Experimental alerting system overview
The experimental alerting system in Kibana watches your Elasticsearch data continuously, so your team doesn't have to. You define the conditions that matter, and the system handles detection, tracking, and notification from there.
This page introduces the five objects in the system and how they connect. Use it to decide where to go next. For a step-by-step walkthrough after a rule runs, refer to How it works.
In the generally available Kibana alerting system, the term alert refers to a tracked occurrence of a rule condition. In the experimental alerting system, the equivalent concept is called an alert episode. Each system's APIs, UI, and instructions apply only to that system's concepts.
The experimental alerting system starts with a rule evaluating your data on a schedule. When the rule detects a match, Kibana writes a rule event to .rule-events. The rule's configuration determines whether those events are grouped into an alert episode and can notify. Events that aren't part of an alert episode remain available for later analysis.
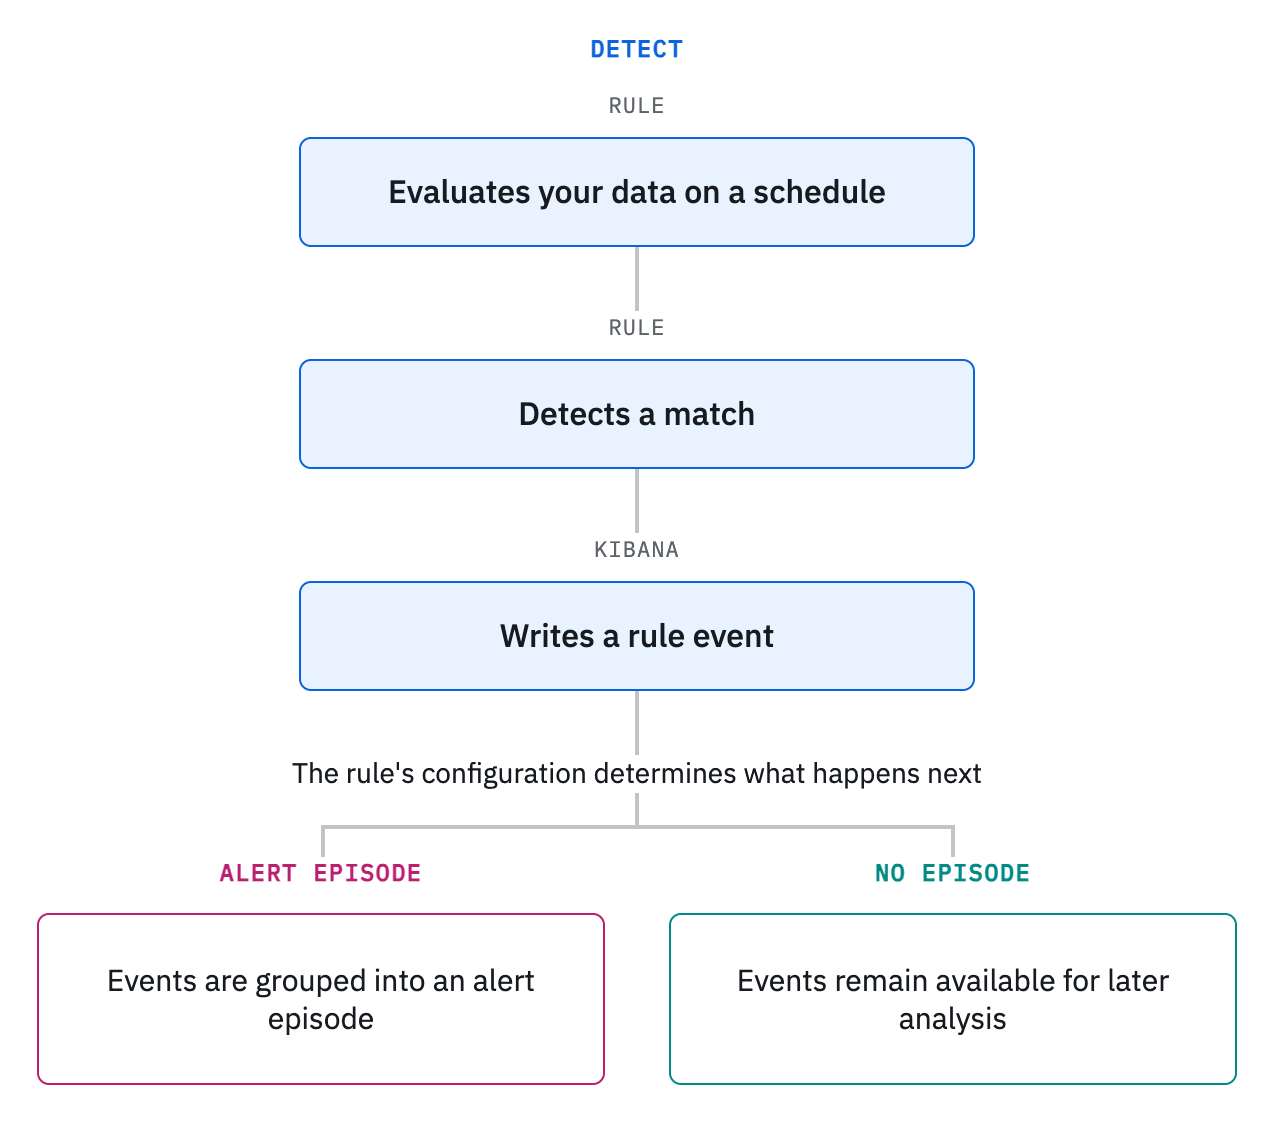
The flowchart is the big picture. The five objects in this section are the pieces you'll create and configure: rules, rule events, alert episodes, action policies, and workflows.
A rule defines what to watch for in your data and how often to check. On each run, Kibana writes matches as rule events.
Refer to Rules to learn more.
A rule event is the document Kibana writes to .rule-events for each match.
Refer to Rule events to learn more.
An alert episode tracks one problem from first detection through recovery, so you triage one lifecycle per problem.
Refer to Alerts to learn more.
An action policy decides whether and when to invoke a workflow for an alert episode. You configure that on the policy, not on the rule, so you can change routing without editing each rule. The workflow sends the notification.
Refer to Notifications and actions to learn more.
A workflow sends the notification or runs the automation, for example posting to Slack, sending an email, or calling a webhook.
Refer to Connect workflows to learn more.
The following diagram is a more detailed version of the same flow. It places the five objects on that path so you can see how they connect.
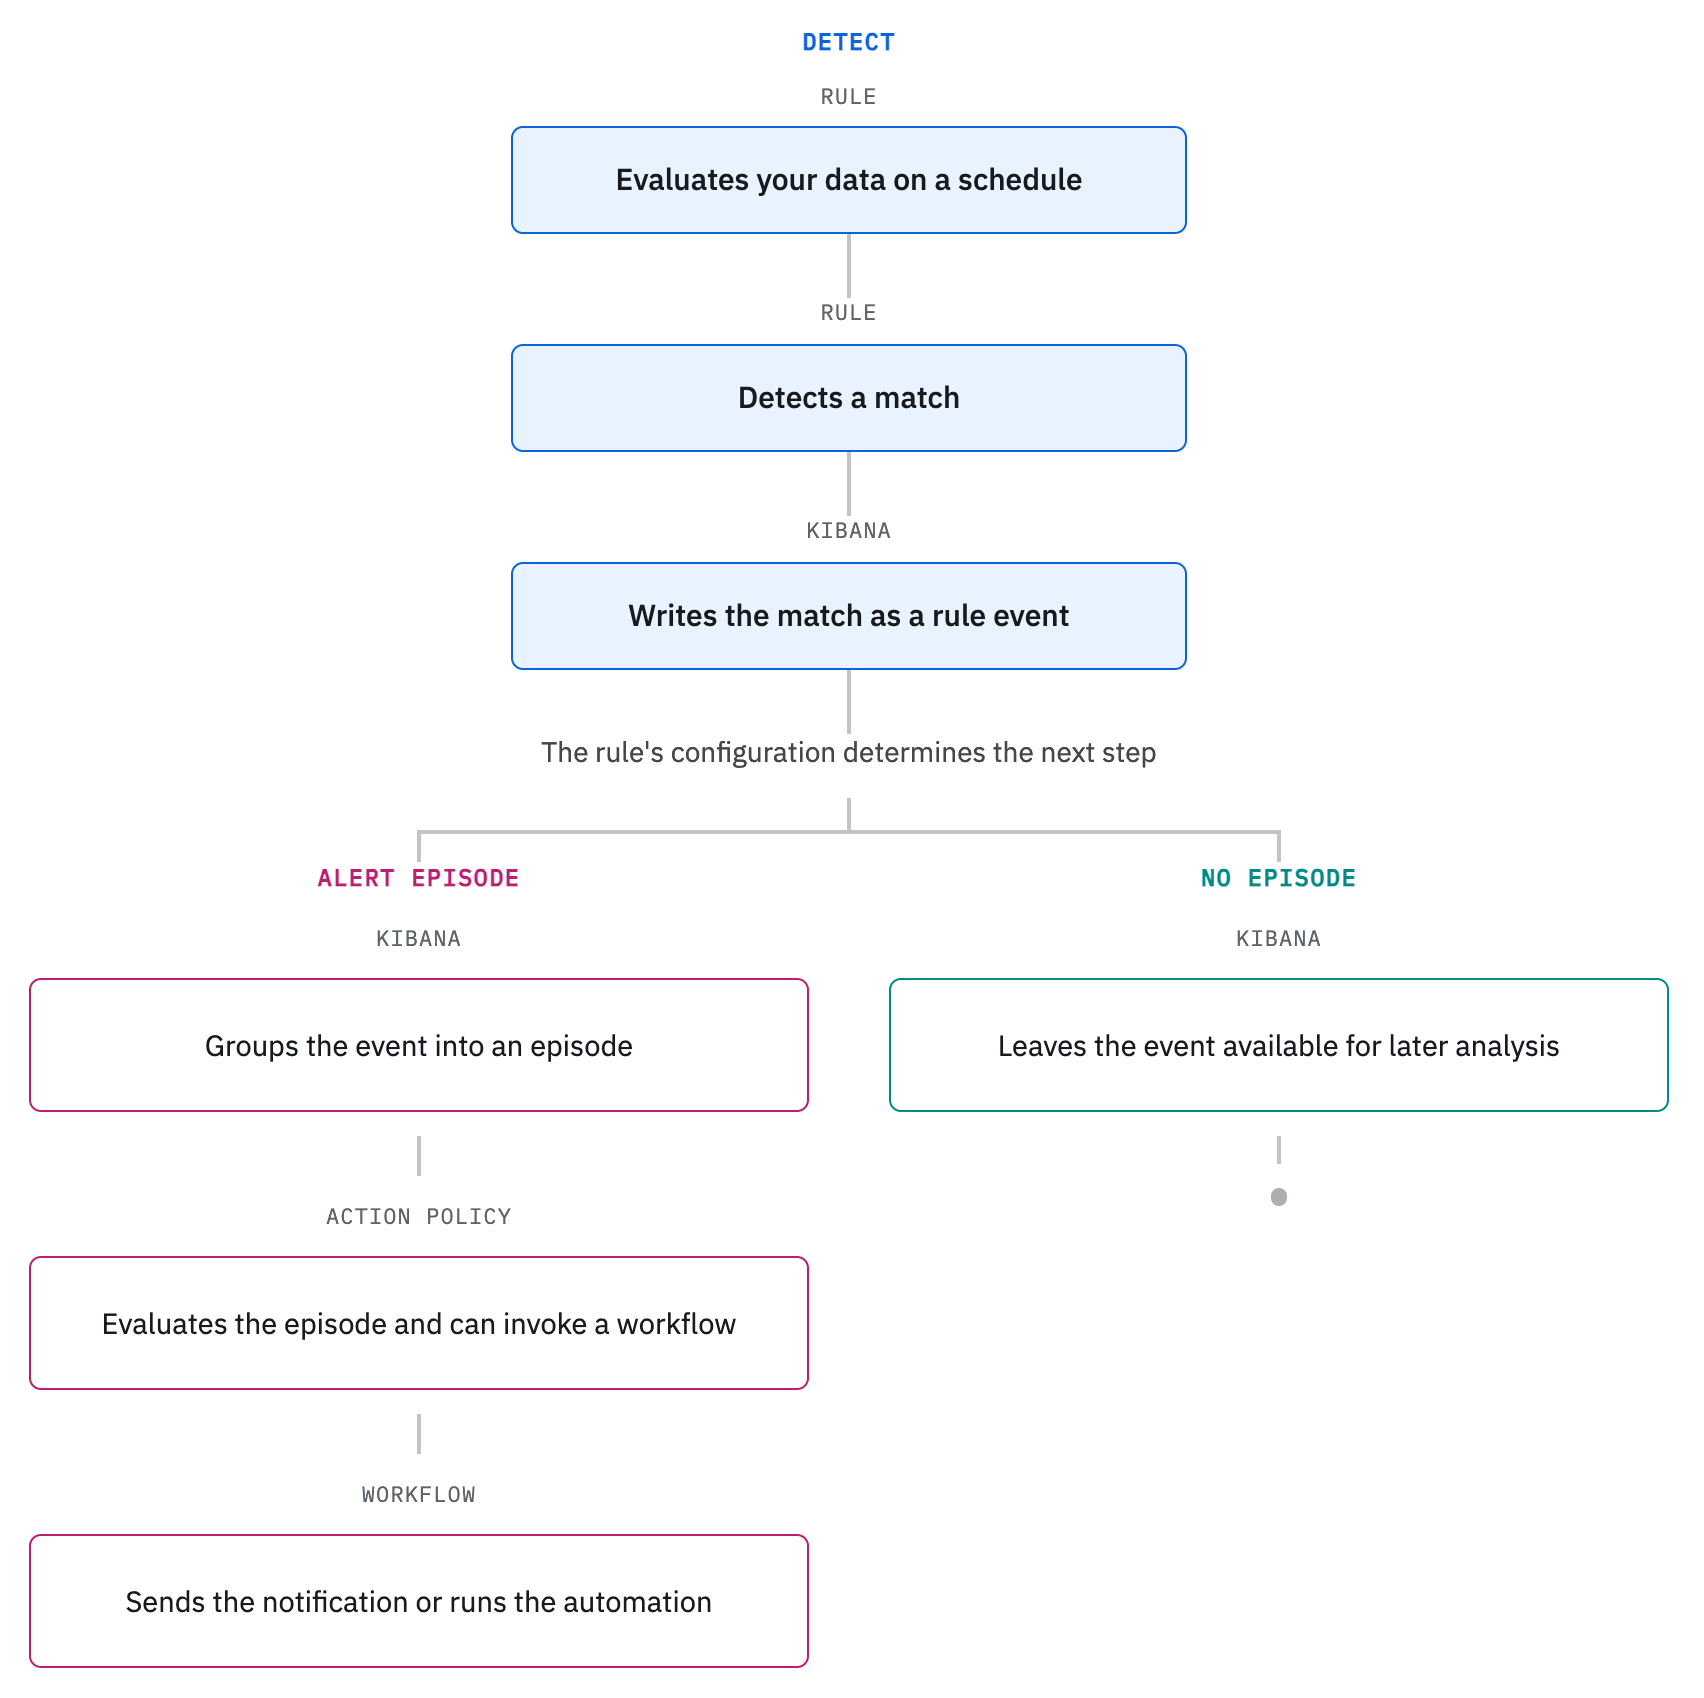
Every match still becomes a rule event. From there, the rule's configuration determines the next step:
Alert episode - Kibana groups the event into an alert episode. An action policy evaluates the alert episode and can invoke a workflow, which sends the notification or runs the automation.
No episode - The event stays in
.rule-eventsfor later analysis. You can query it in Discover, build dashboards, or feed it into another rule. Rule events that aren't part of an alert episode (type: signal) don't appear on Alerts and aren't evaluated by action policies or lifecycle triggers.
- New to the experimental alerting system? Get started walks you through enabling the system, setting up role access, and creating your first rule with a hands-on tutorial.
- Wondering what you can detect? Rules shows you how to define what to watch for in ES|QL, and how to choose and configure the right creation path for your use case.
- Curious what happens when something breaks? Alerts explains how alert episodes track a problem from first detection through recovery, and how to triage them as they come in.
- Want the right people to know when it matters? Notifications and actions shows you how action policies decide when to invoke a workflow, and how workflows send the notification.