Get started with ES|QL in Discover
In this tutorial, you explore the Kibana sample web logs in Discover with Elasticsearch Query Language (ES|QL). You build one query step by step and see how each command changes the results in the table and the chart.
You don't need a data view, and you don't need ES|QL experience. For the rest of Discover, refer to Explore fields and data with Discover. For the language itself, refer to the ES|QL reference.
By the end of this tutorial, you'll know the main elements of your query and how they shape the results you see in Discover. You'll practice how to:
- Query a data source with
FROM. - Keep only the columns you need with
KEEP. - Filter the results with
WHERE. - Find the top results with
SORTandLIMIT. - Count the results by group with
STATS. - Save your query as a Discover session.
-
Before you begin
To follow this tutorial, you need the following:
- ES|QL enabled in Kibana. It's enabled by default. On Elastic Stack deployments, an administrator can turn it off with the
enableESQLadvanced setting. - The Kibana sample web logs. Add them from Add sample data. You can use your own indices instead. Replace
kibana_sample_data_logsin the examples with a data source you can query, and replace the field names in later steps with fields from your data.
Depending on the solution you use and the data you query, Discover can show slightly different columns and options than this tutorial. Refer to Context-aware data exploration.
To help you go faster with what you learn in this tutorial, or to go further once you know the basics, the ES|QL editor offers several tools. It suggests commands, fields, and values as you type, and its in-app help shows the syntax of each command. Depending on your version and setup, you can also browse data sources and fields, filter your data with KQL, or have AI write or fix a query. This tutorial has you write each command yourself so that you learn what it does. Refer to Write queries with the ES|QL editor.
- ES|QL enabled in Kibana. It's enabled by default. On Elastic Stack deployments, an administrator can turn it off with the
-
Query a data source
In ES|QL mode, the query decides which data you explore. There is no data view to select as in classic mode. Instead, the first command of every query names the data source, and the table and the chart show what that source returns.
This first command is a source command:
FROMis the generic ES|QL source command. It takes the names of the sources to read, for example, an index or a data stream. You can list several names or match them with a wildcard, such asFROM logs-*.- Other source commands serve specific cases. For example,
TSqueries time series data streams, andPROMQLruns a Prometheus Query Language (PromQL) query.
Command names aren't case-sensitive, so
fromandFROMare the same.Open Discover from the navigation menu or the global search field.
If the editor isn't in ES|QL mode yet, select Query in ES|QL (Try ES|QL in earlier versions) in the application menu. For other ways to switch, refer to Switch between ES|QL and classic mode.
Set the time filter to the seven days before you installed the sample data. Kibana sets the sample timestamps relative to the day you install the data. If you installed it today, select Last 7 days. Otherwise, set a custom range that ends on the installation date.
The sample web logs have an
@timestampfield, so Discover uses it for the time filter and the chart over time. The time filter keeps only the results in the range you select, and the chart shows how they spread over that range.TipIf you use your own data and it has no
@timestampfield, refer to Set the time filter for the table and the chart.Enter the following query in the editor:
FROM kibana_sample_data_logsTo query your own data, replace
kibana_sample_data_logswith the name of your source. If you don't know the name, browse the data sources from the editor.Select Search (or ▶Run in earlier versions).
Result: The table lists up to 1,000 results by default, with the time and a Summary of each result. The chart shows how the results spread over those seven days. It counts all the matching results in the time range, not only the 1,000 rows in the table. If the table is empty, widen the time range.
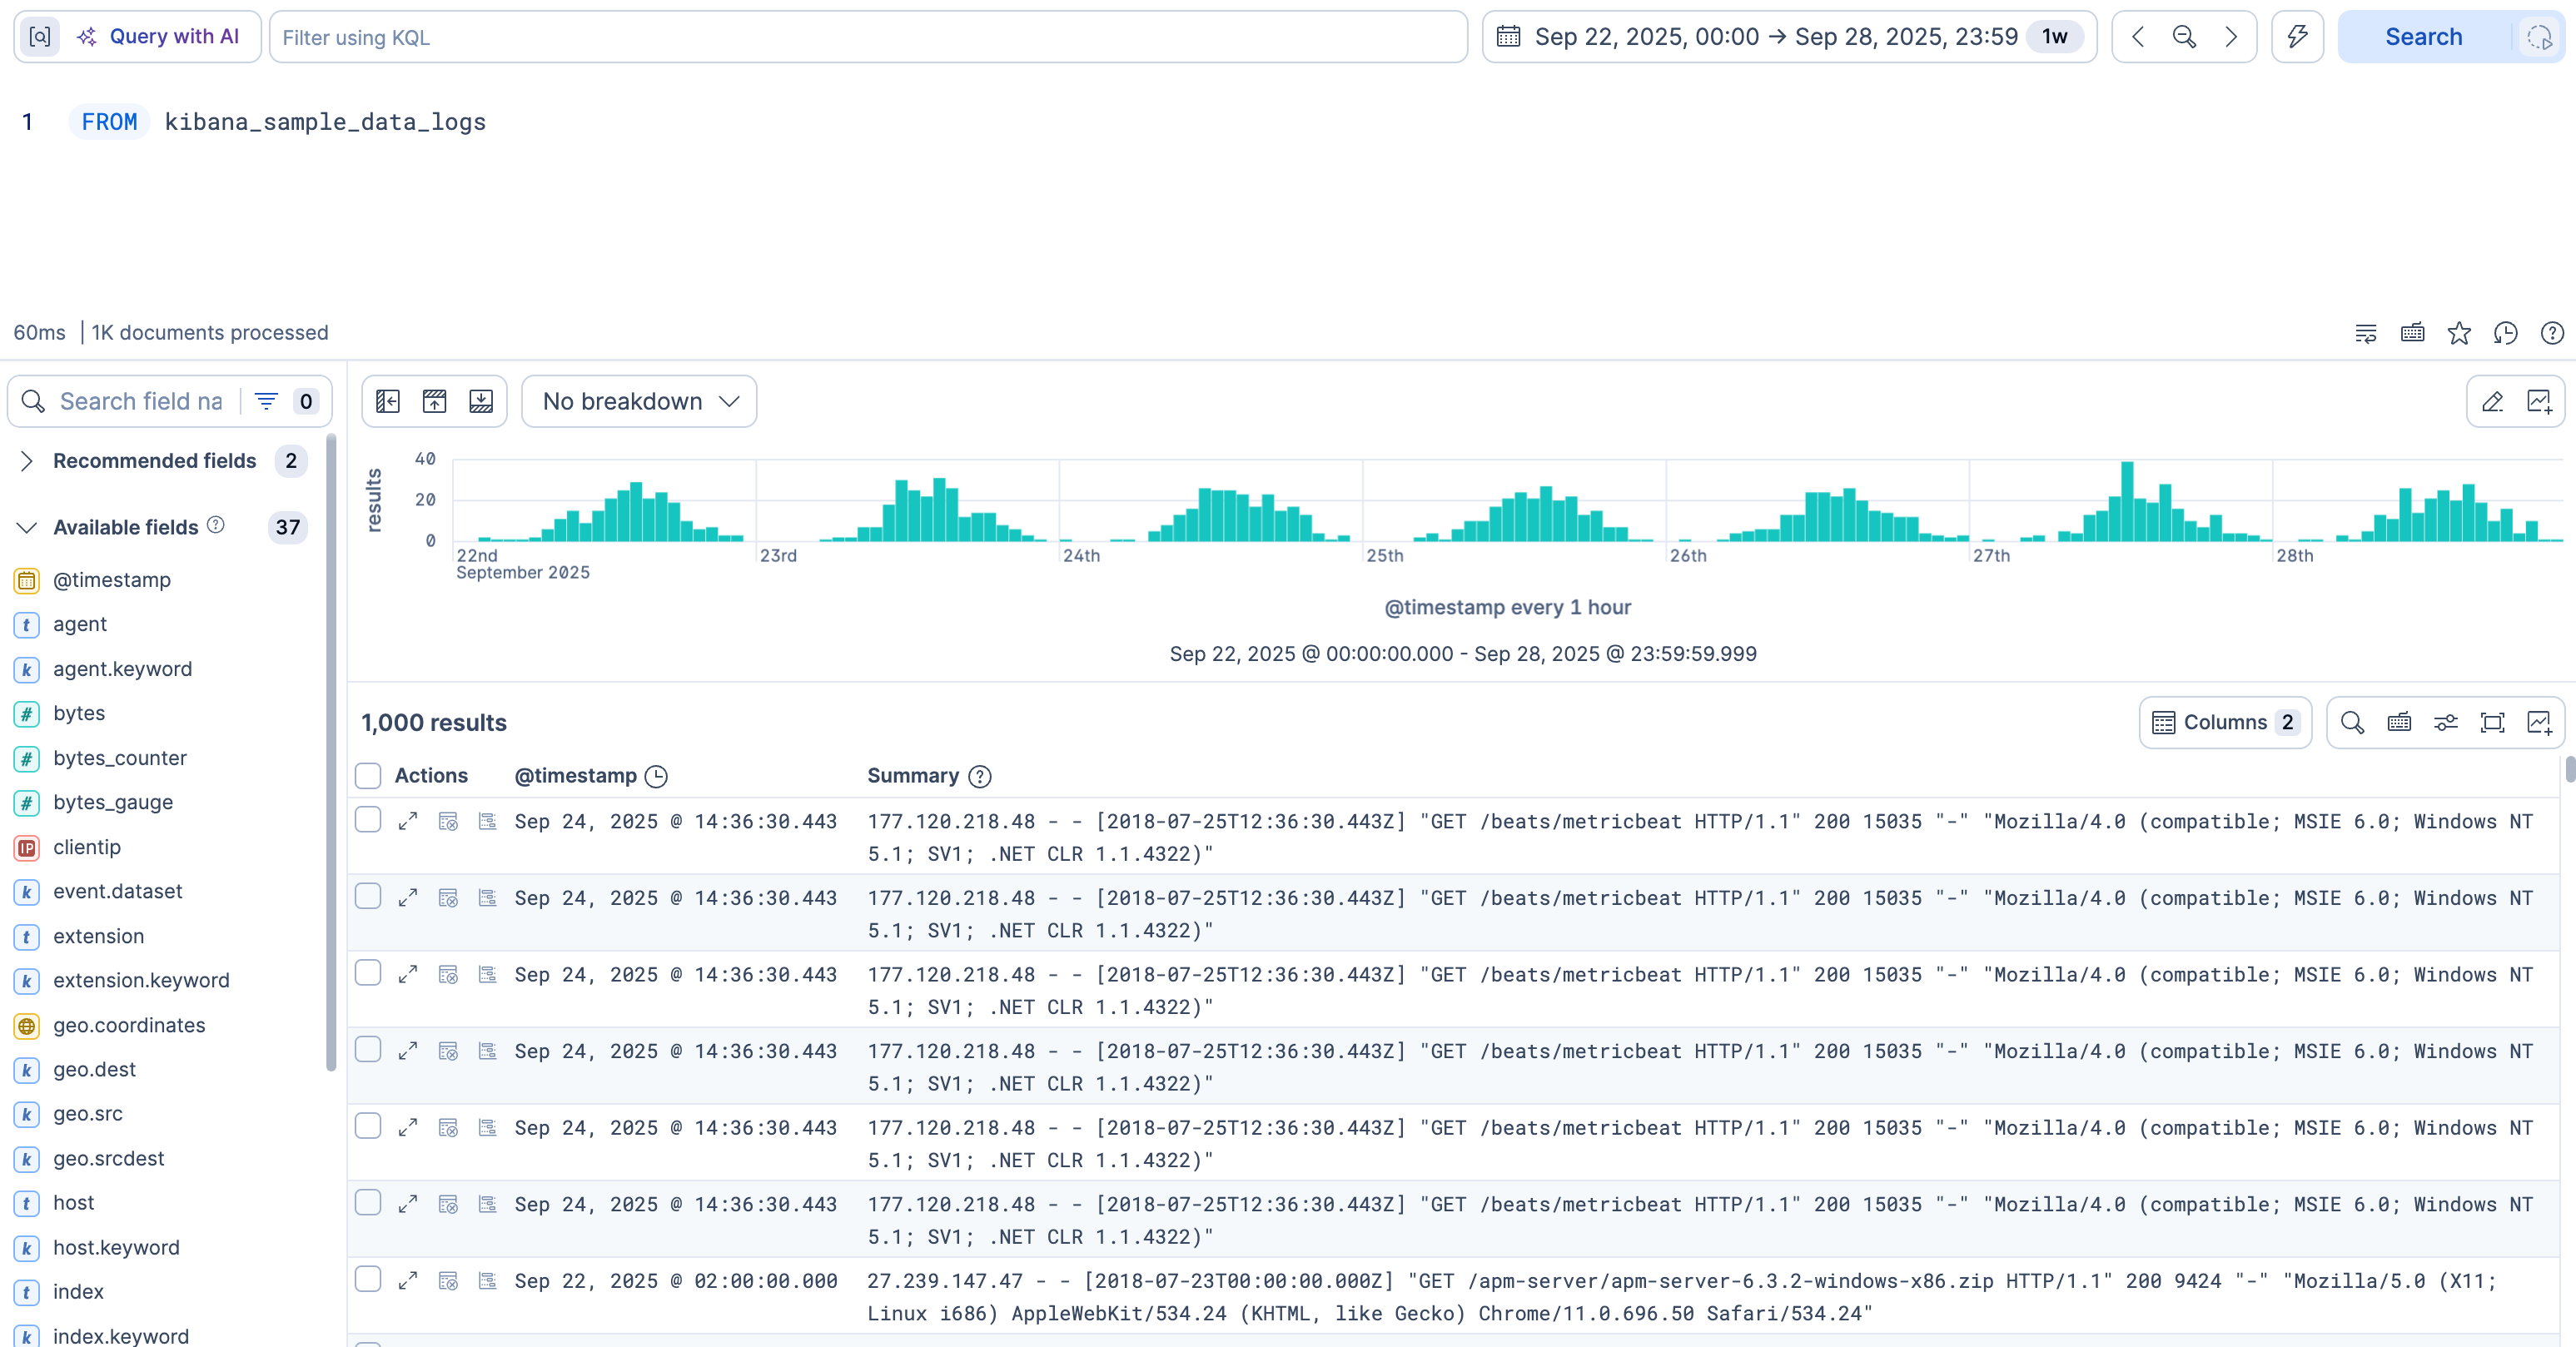
The table isn't the end of your exploration. To look at one result in detail, select View details (Toggle dialog with details in earlier versions) on its row. The flyout lists all its fields, and you can filter the results from any of its values. Refer to Explore individual result or document details in depth.
-
Keep only the columns you need
Each result has dozens of fields, but the table shows only the time and a Summary by default. To answer a question, you usually need a few specific fields as their own columns. In this step, you keep four fields: the response size, the destination country, the operating system, and the response code.
An ES|QL query is a chain of commands separated by pipes (
|). Each command after the source command takes the results of the previous command, changes them, and passes them on. Commands run in the order you write them.Commands after the source command are processing commands.
KEEPis one of them. It keeps only the columns you list, in that order. It doesn't remove any results.Once
KEEPsets the columns, Discover builds a chart from them instead of the chart over time. The two charts use different rows. The chart over time uses every matching result in the time range. A chart built from your columns uses only the rows that the query returns, so at most 1,000 by default.Add a
KEEPline to the query:FROM kibana_sample_data_logs | KEEP bytes, geo.dest, machine.os, response.keywordAs you enter a field name, the editor suggests matching fields. Select a suggestion to insert it. Refer to Autocomplete and in-app help.
Select Search.
Result: The table shows four columns:
bytes,geo.dest,machine.os, andresponse.keyword. The number of results stays the same, and Discover now picks a chart that fits the columns you kept, such asbytesbygeo.dest. The time filter still applies, even though@timestampis no longer a column.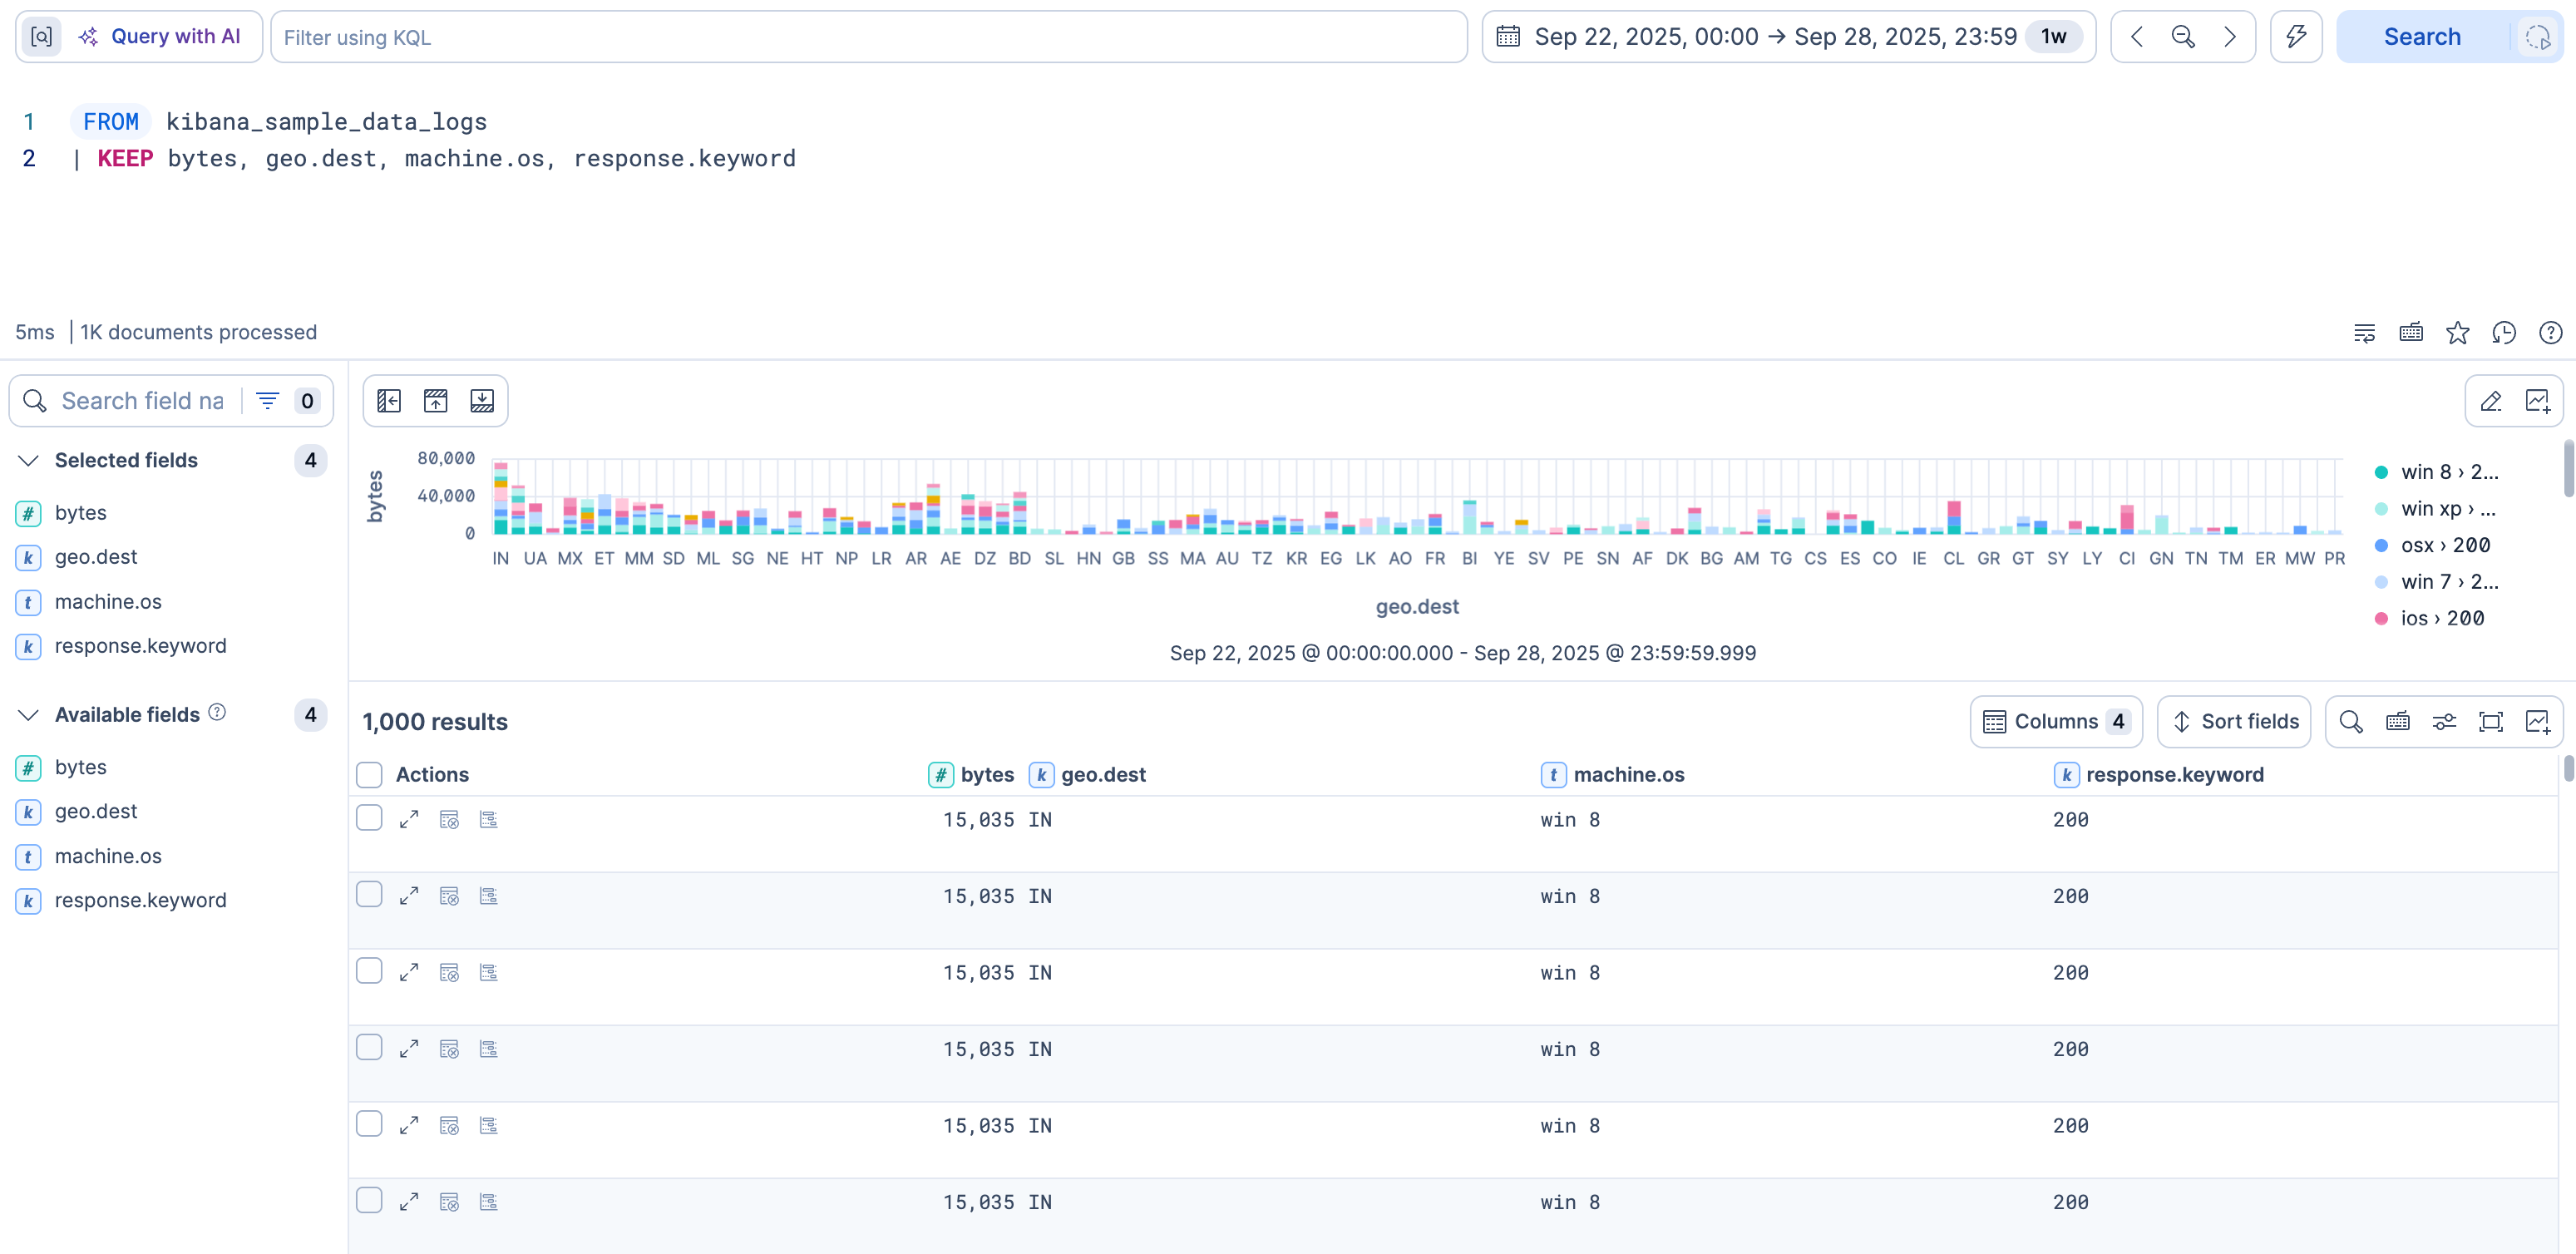
You can also add a column from the fields list. This changes only the table, not the query, so the chart keeps showing the results over time. It works well for a quick look at a field. Use
KEEPwhen the columns are part of your question, because they're saved with the query, for example, in a Discover session or on a dashboard. Refer to Show specific columns in the results table. -
Filter the results
Filtering keeps only the results you care about. In this step, you exclude the results whose destination is the United Kingdom (
GB).WHEREkeeps only the results that match a condition. A condition uses an operator, such as==,!=,>, or<, to compare a field with a value. You can combine conditions withANDandOR. Put text values in double quotation marks.Because
WHEREremoves results, it changes both the table and the chart.Add a
WHEREline to the query:FROM kibana_sample_data_logs | KEEP bytes, geo.dest, machine.os, response.keyword | WHERE geo.dest != "GB"The
!=operator keeps every result whose destination isn'tGB.Select Search.
Result: The results with
GBas their destination are gone from the table and from the chart. The result count stays at 1,000 because of the default limit, but nogeo.destvalue isGB.You can also filter from the table, so you don't need to enter the field name and value. Hover over a value, then select Filter for this or Filter out this, and Discover writes the
WHEREline for you. Refer to Filter from a value in the results table.TipIf you know KQL, you can also filter from the editor's search bar. When you submit a KQL query there, Discover replaces your whole query with a
FROMcommand and aWHERE KQL()line that contains your KQL query. Commands such asKEEPare removed, so to keep building on your query, useWHERE. -
Find the top results
Sorting and limiting bring the results you want to the top, such as the largest responses. In this step, you list the 10 results with the highest
bytesvalue.SORTorders the results by a field, in ascending (asc) or descending (desc) order.LIMITkeeps only the first results. Because commands run in order,SORTfollowed byLIMIT 10returns the top 10. WithoutSORT,LIMIT 10returns any 10 results.LIMITalso replaces the default limit of 1,000 results.Add
SORTandLIMITlines to the query:FROM kibana_sample_data_logs | KEEP bytes, geo.dest, machine.os, response.keyword | WHERE geo.dest != "GB" | SORT bytes desc | LIMIT 10Select Search.
Result: The table lists 10 results, starting with the highest
bytesvalue. The chart now reflects only these 10 results.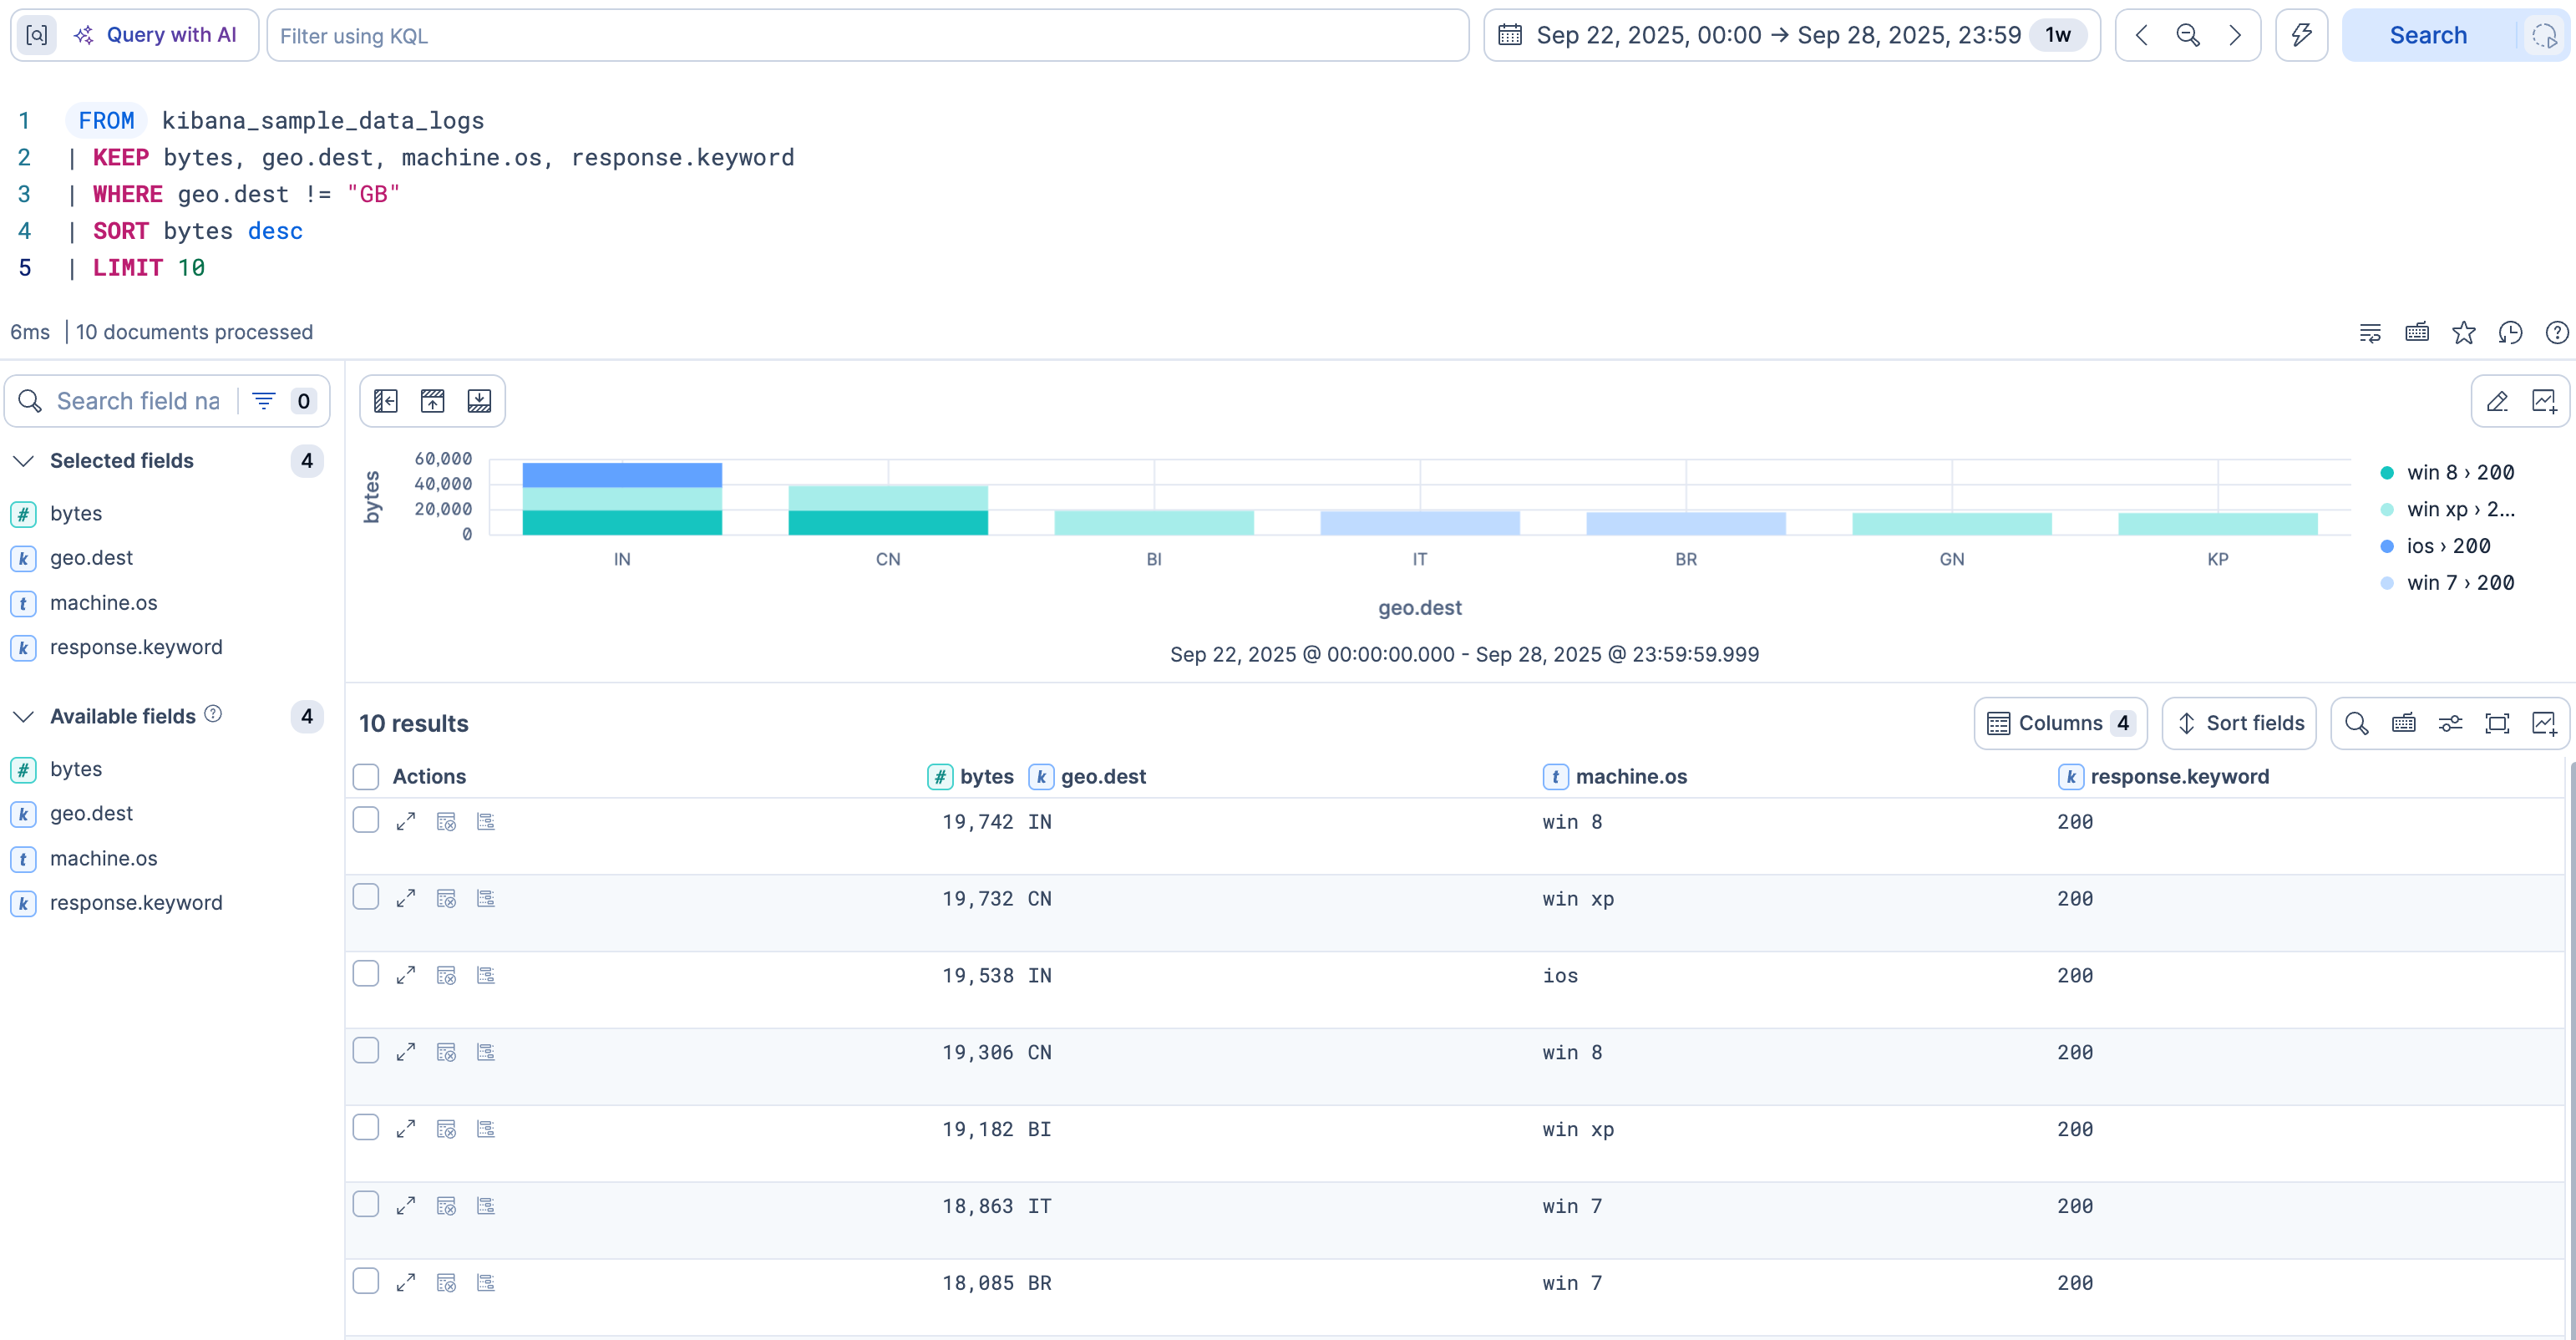
Sorting from a column header in the table is different. It reorders only the results already in the table, and it doesn't change which results the query returns. Refer to Sort query results.
-
Count the results by group
So far, each row in the table is one result. To find out which destinations appear most often, you need one row per destination, with a count. In this step, you count the results for each destination.
STATSaggregates the results. An aggregation function, such asCOUNT,AVG, orSUM, computes a value, andBYsets the groups. InSTATS count = COUNT(*) BY geo.dest,COUNT(*)counts the results in each group, andBY geo.destmakes one group per destination.count =names the new column, which is separate from theCOUNTfunction.After
STATS, each row is a group, not a single result. The query returns only the newcountcolumn and theBYcolumn,geo.dest. That's why the query no longer needsKEEP, and whySORTnow usescount. The query also dropsLIMIT 10, so the table lists every destination instead of the first 10. TheWHEREline stays beforeSTATS, so the counts still exclude the United Kingdom.Replace the query with the following one:
FROM kibana_sample_data_logs
| WHERE geo.dest != "GB"
| STATS count = COUNT(*) BY geo.dest
| SORT count desc
Select Search.
Result: The table shows each destination as a group with its count, starting with the highest. The counts include every matching result in the time range, because the default limit applies to the rows the query returns, which are now the groups. The chart shows the same counts. You can expand a group to see the results behind it.
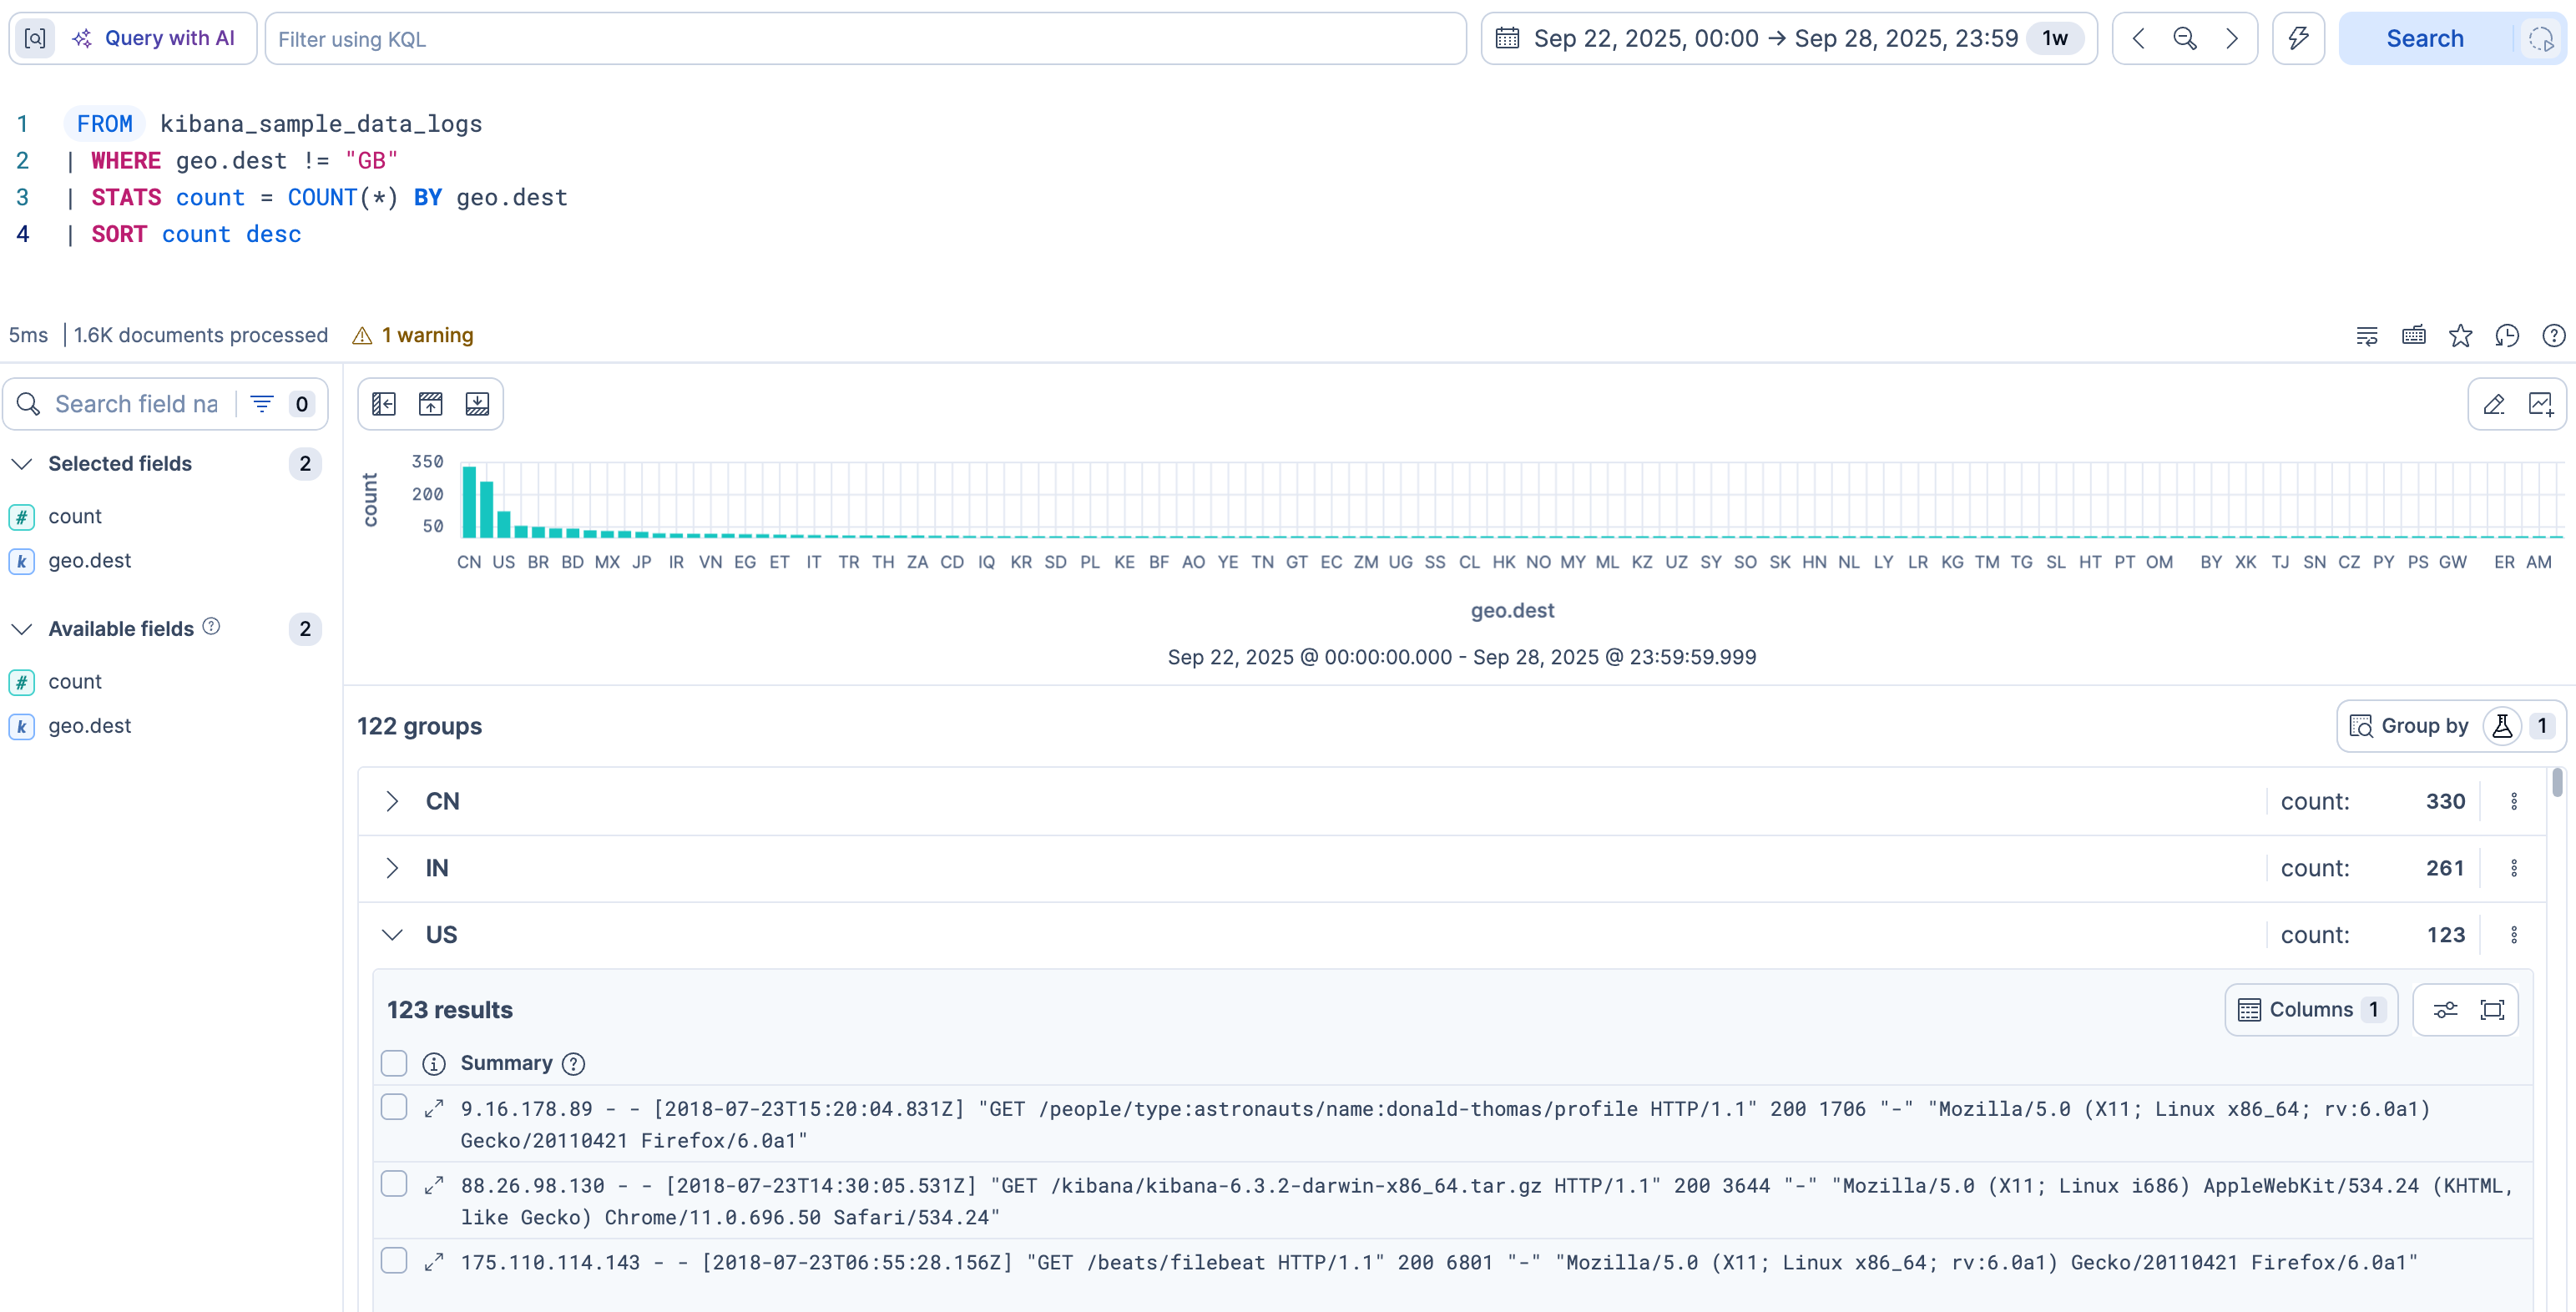
STATScan compute several values at once, or group results by time to show a trend. Refer to theSTATScommand. To look at the results behind a group, refer to Inspect grouped STATS results in Discover. -
Save your exploration
Your query holds your whole exploration. Save it as a Discover session to come back to it, share it, or build on it later.
A Discover session saves the query, not a copy of the results. When you open the session again, Discover runs the query again, so the results reflect the current data.
Select Save in the application menu.
In the Title field, enter a name, for example
Results by destination.To reopen the session with the same time range, turn on Store time with Discover session.
Select Save.
Result: Discover saves the session. To reopen it later, select Open session in the application menu, then select the session.
To share the session, refer to Share your Discover session. To add the chart or the table to a dashboard, refer to Keep the chart or the table.
- Use Discover with ES|QL: Explore the other ES|QL tasks in Discover, including variable controls.
- Create lookup indices from Discover queries: Add fields from a lookup index with
LOOKUP JOIN. - Detect change points in Discover: Find a spike, dip, or shift in a time series.
- ES|QL reference: Look up commands, functions, and operators beyond this tutorial.
- Use ES|QL in the Kibana UI: Use editor tools, time parameters, AI assistance, and Fast mode.
- Learn data exploration and visualization with Kibana: Follow a longer path from Discover into dashboards.