ES|QL
Elastic Stack Serverless
You can add ES|QL visualizations to a dashboard directly from queries in Discover, or you can start from a dashboard.
In Discover, typing ES|QL queries automatically shows a visualization. The visualization type depends on the content of the query: histogram, bar charts, etc. You can manually make changes to that visualization and edit its type and display options using the pencil button ![]() .
.
You can then Save and add it to an existing or a new dashboard using the save button of the visualization ![]() .
.
From your dashboard, select Add panel.
Choose ES|QL under Visualizations. An ES|QL editor appears and lets you configure your query and its associated visualization. The Suggestions panel can help you find alternative ways to configure the visualization.
TipCheck the ES|QL reference to get familiar with the syntax and optimize your query.
When editing your query or its configuration, run the query to update the preview of the visualization.
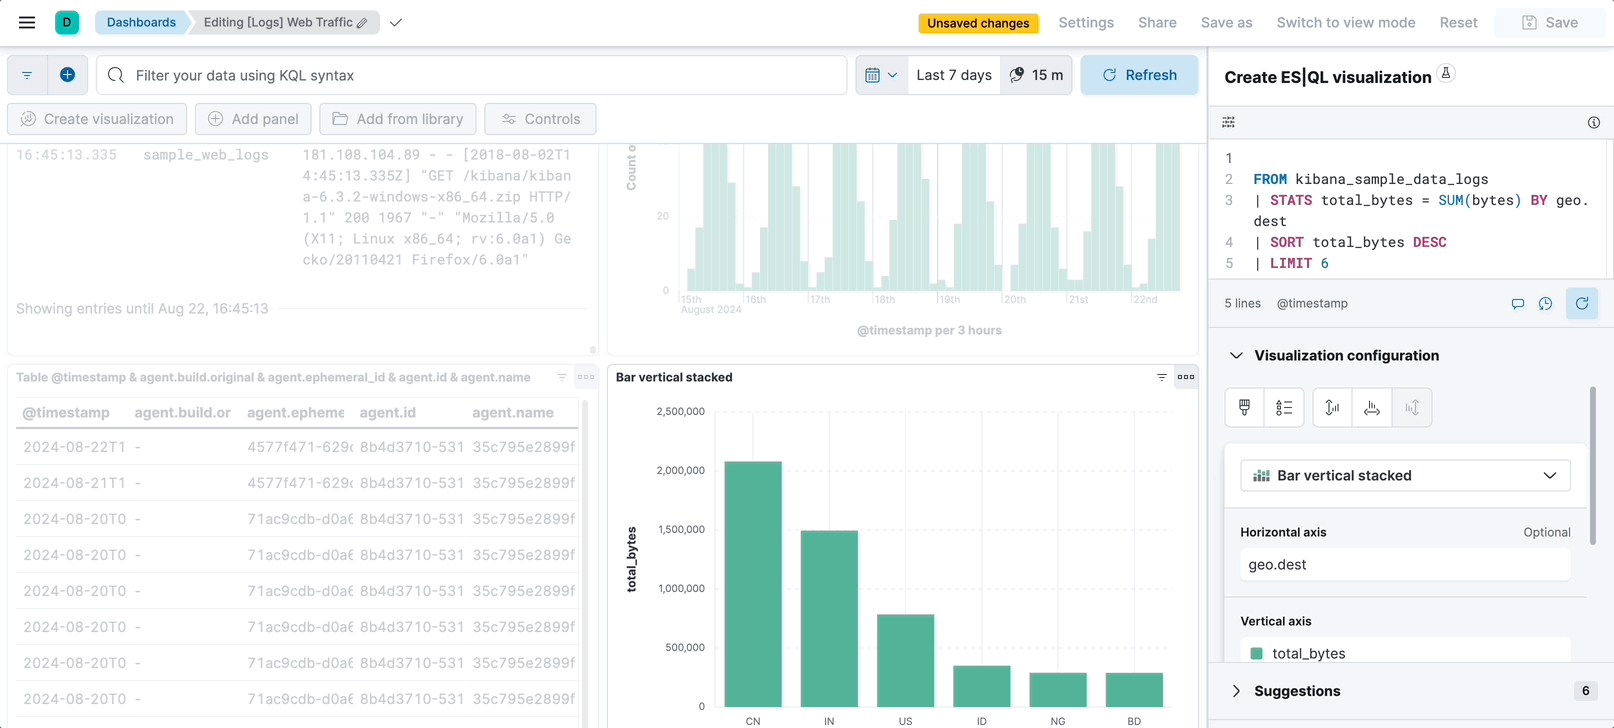
Select Apply and close to save the visualization to the dashboard.