Inspect grouped STATS results in Discover
When your ES|QL query uses a STATS BY clause with a single grouping field, Discover displays the results as expandable groups instead of a flat table. Each row represents one unique value of the grouping field. You can expand it to inspect the underlying documents without leaving the query.
- You need an ES|QL query in Discover. If you are new to that editor, start with Get started with ES|QL in Discover.
- The grouped layout activates when the
BYclause contains a single field reference or a singleCATEGORIZEcall. Other grouping functions likeBUCKETorTBUCKET, and queries that group by more than one field (for example,BY clientip, extension), keep the standard flat results table. Queries that useTS_INFOorMETRICS_INFOalso keep the flat results table, because those commands return synthetic metric-metadata rows that have no underlying documents to expand.
In Discover, in ES|QL mode, enter a
STATS BYquery with a single grouping field. For example:FROM kibana_sample_data_logs | STATS Count = COUNT(*) BY Pattern = CATEGORIZE(message) | SORT Count DESCSelect Search.
Result: The table lists one row per group. The results count above the table reports the number of groups instead of the number of documents.
NoteWhen searching large datasets, you can get faster, estimated results by using Fast mode. Refer to Use ES|QL in the Kibana UI > Get faster results with approximate STATS.
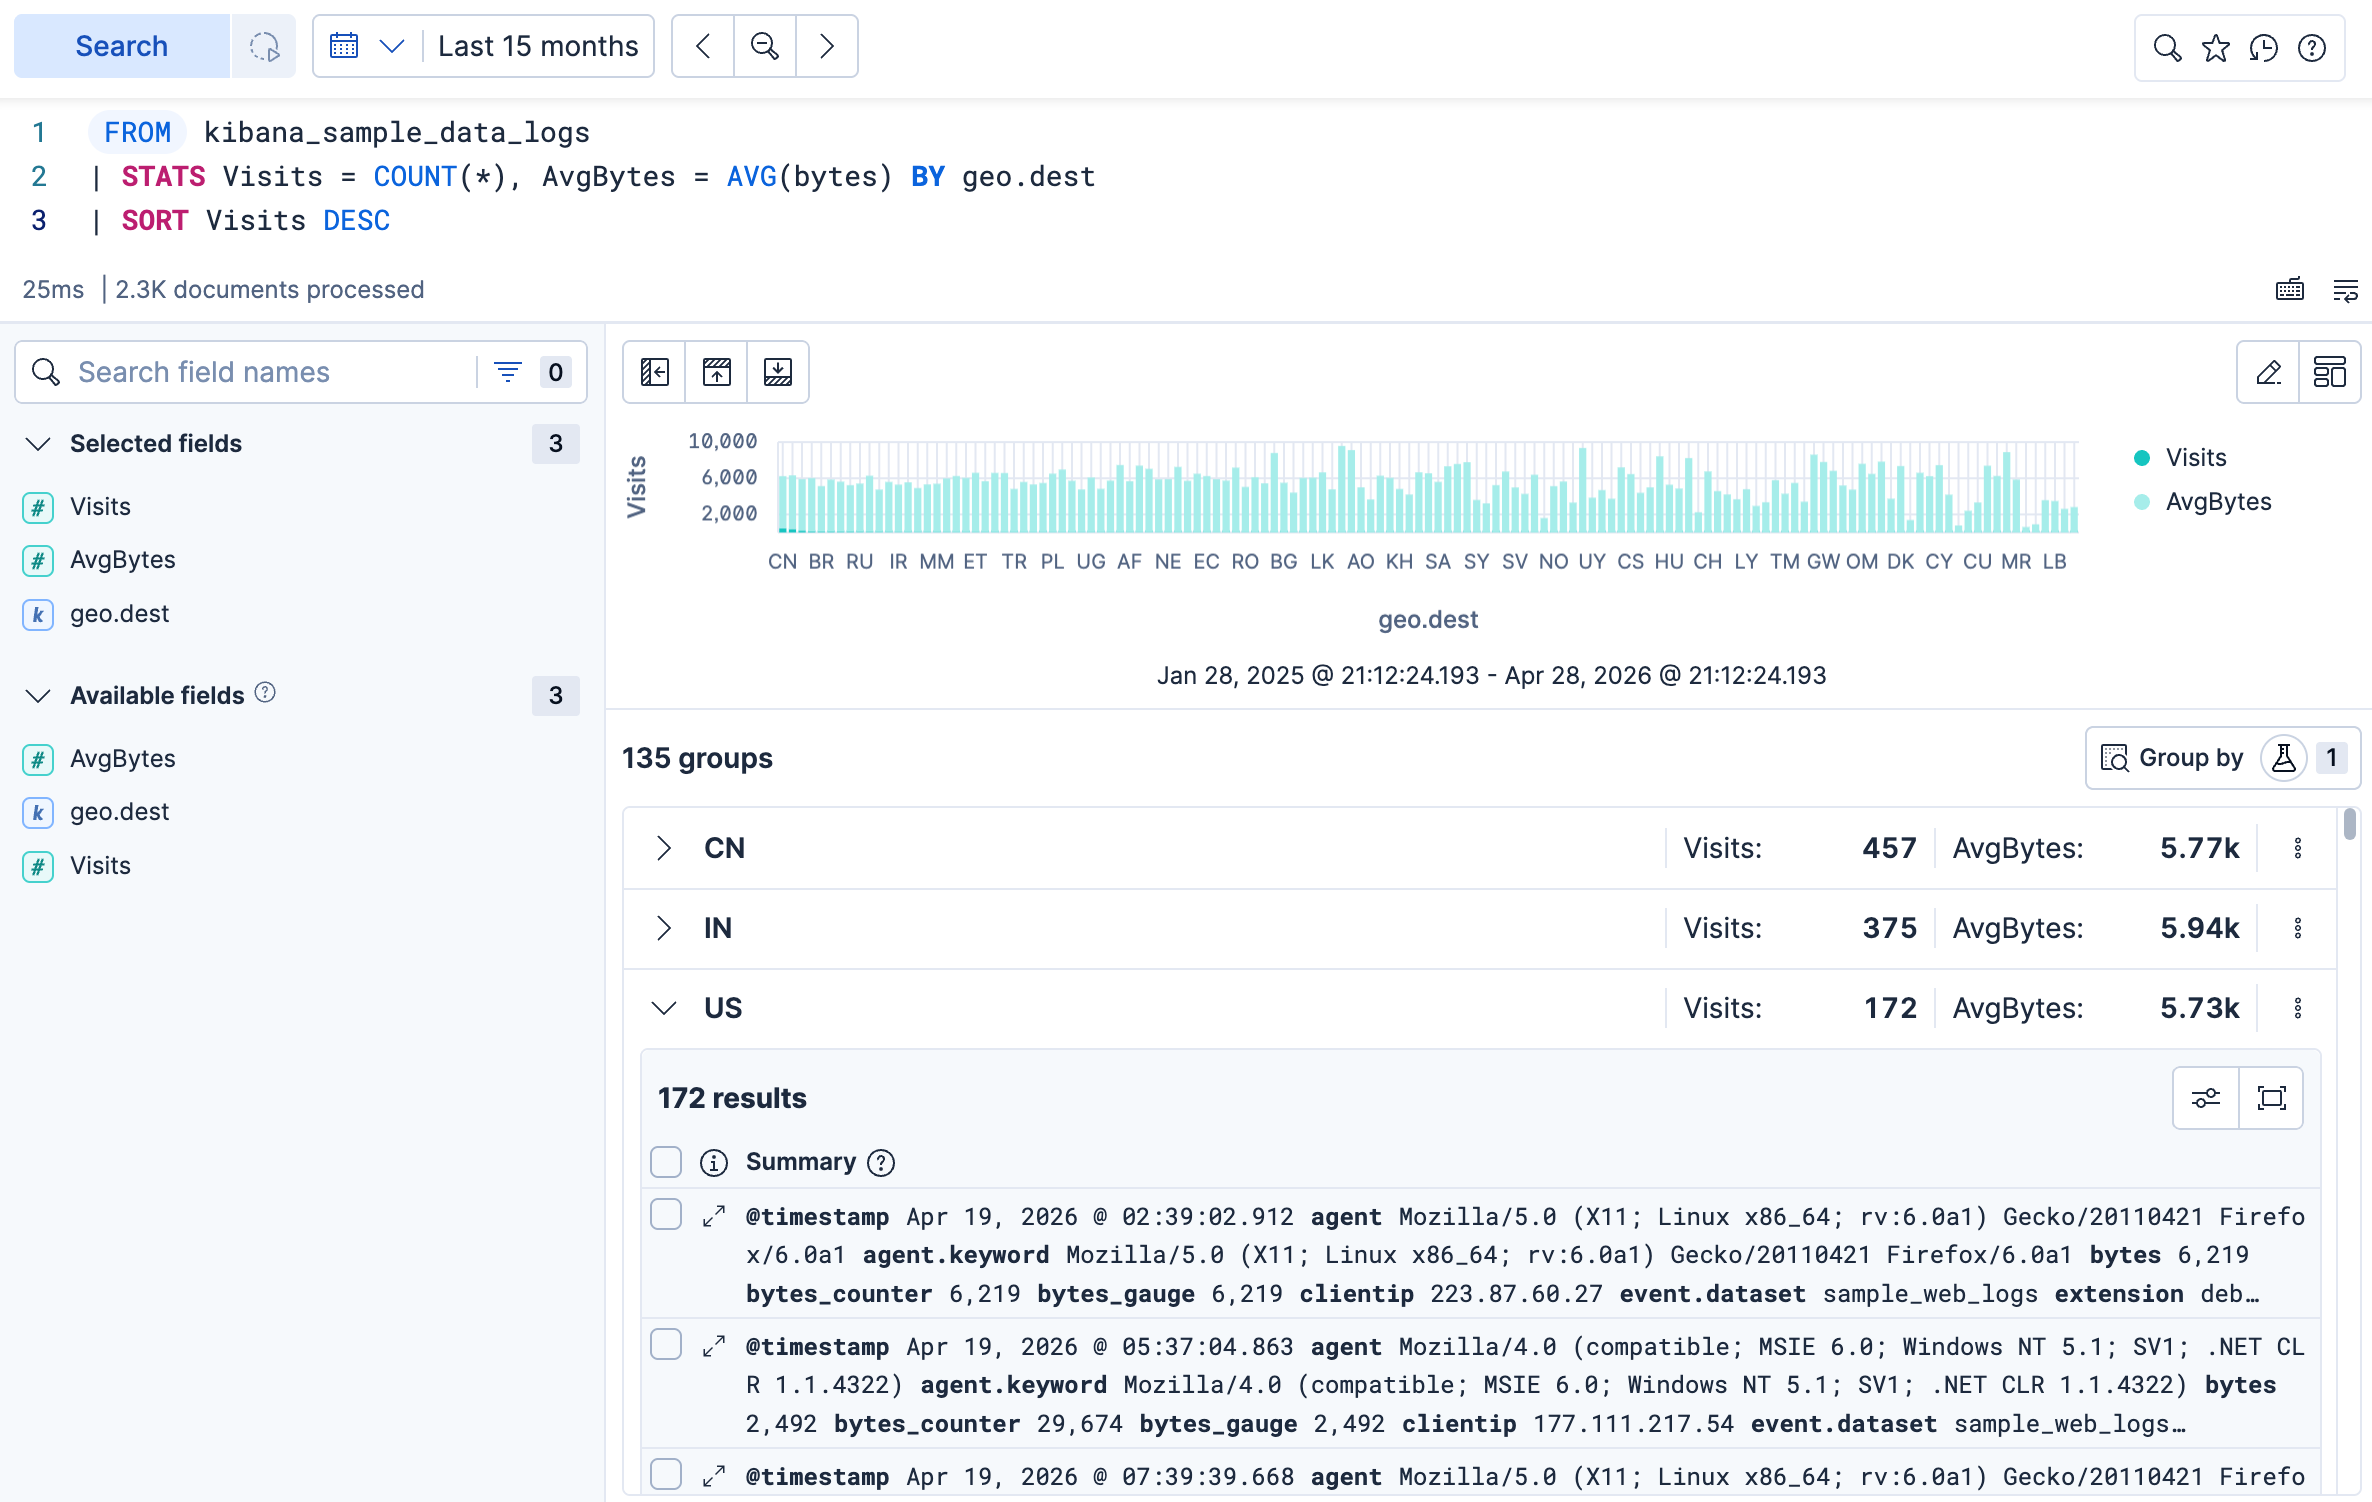
Expand a row to inspect the underlying documents.
When the grouping field uses CATEGORIZE, each row title shows the detected pattern with token highlighting, so you can scan repeated message structures at a glance.
Pattern detection on text fields is also available outside ES|QL from the Patterns view in Discover's classic mode. Refer to Run a pattern analysis on your log data.
When the query also computes a SPARKLINE over time, Discover renders an inline chart next to the row aggregates. For example, the following query categorizes log messages and renders a sparkline for each pattern:
FROM kibana_sample_data_logs
| WHERE @timestamp >= ?_tstart AND @timestamp < ?_tend
| STATS Count = COUNT(*),
        Sparkline = SPARKLINE(COUNT(*), @timestamp, 40, ?_tstart, ?_tend)
    BY Pattern = CATEGORIZE(message)
| SORT Count DESC
On larger data sets, add a SAMPLE command before STATS to keep the categorization fast, and divide COUNT(*) by the same sample fraction to keep the counts representative. For example, SAMPLE 0.001 followed by Count = COUNT(*) / 0.001.
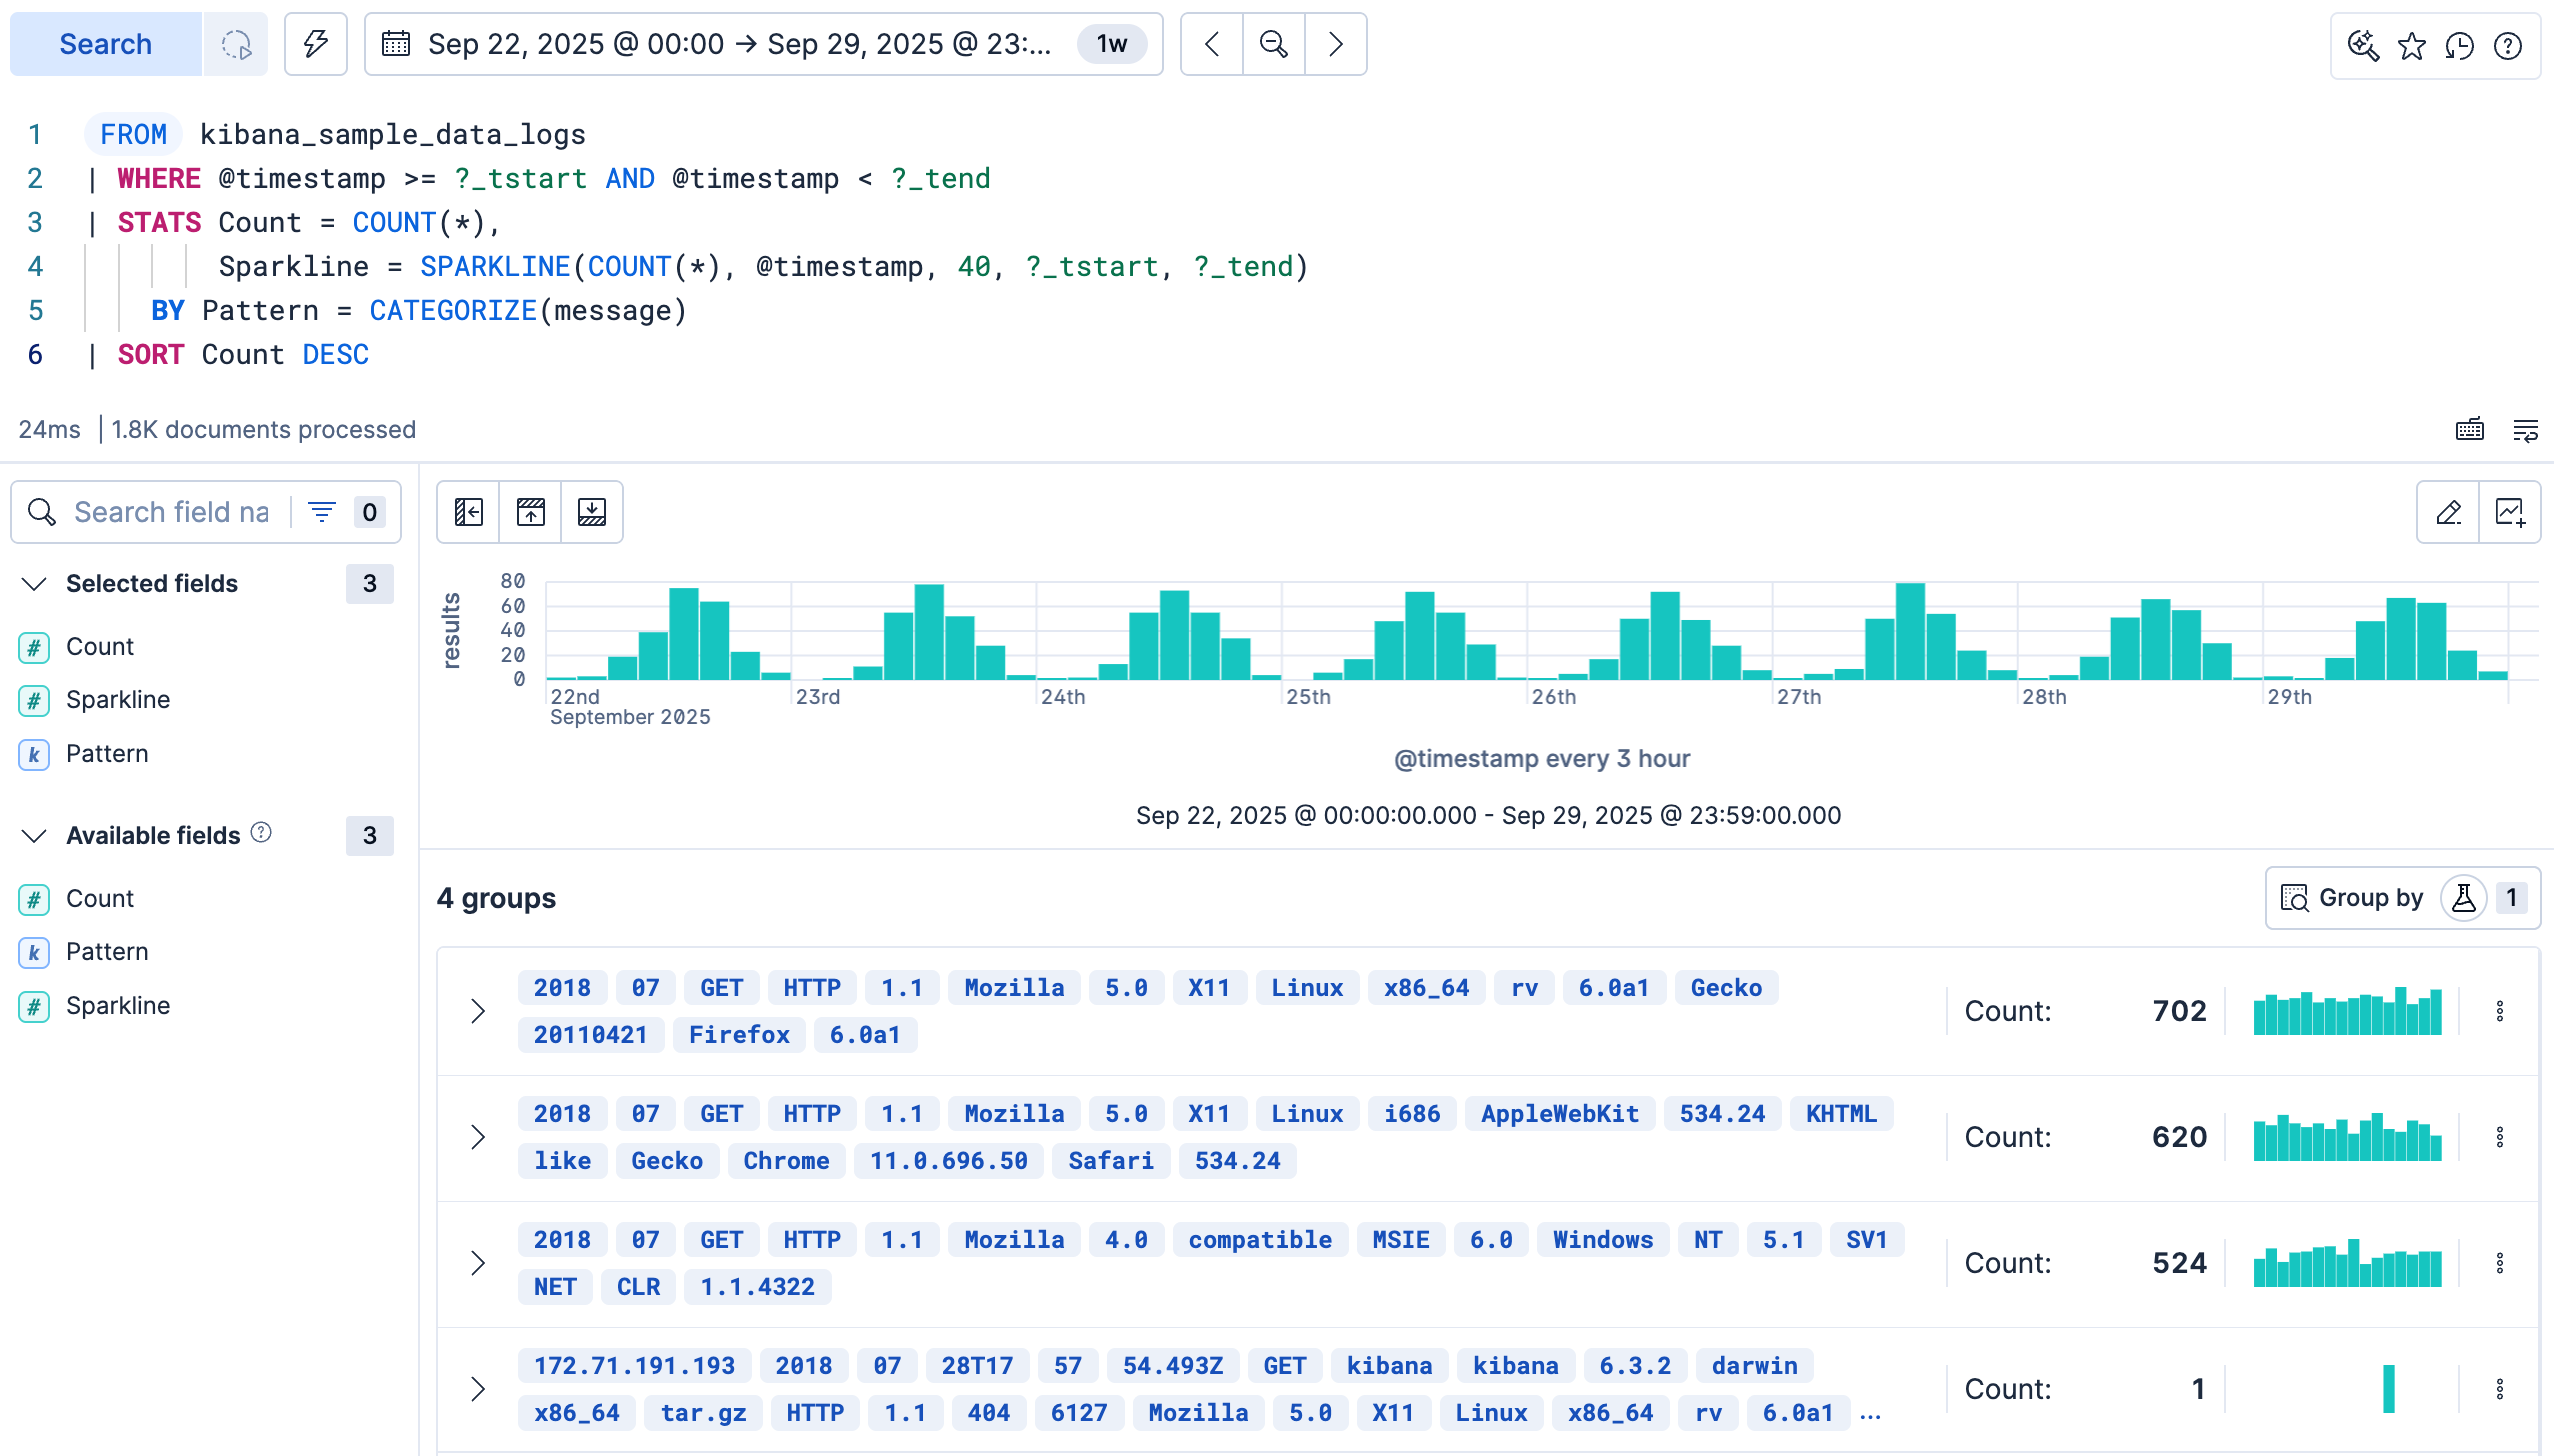
Select the actions button on any group row to:
- Copy to clipboard: copy the group's value.
- Filter in: append a
WHEREclause to your query that keeps only documents matching this group. - Filter out: append a
WHEREclause that excludes documents matching this group. - Open in new tab: open the documents in this group in a new Discover tab, with a query scoped to that group.
Filter in and Filter out aren't available when the grouping field is not filterable.
When the grouped layout activates, the regular results table toolbar is replaced with a Group by button. The button shows the number of active groupings as a badge.
The grouping field is preselected from your STATS BY clause. Open the Group by menu and select none to fall back to the standard flat results table and bring back the regular toolbar.