Add variable controls to Discover queries
Variable controls help you make your queries more dynamic instead of having to maintain several versions of almost identical queries. Viewers change the value from the control. The query stays one query.
- You need an ES|QL query in Discover. If you are new to that editor, start with Get started with ES|QL in Discover.
You can add them from your Discover ES|QL query.
While you edit your ES|QL query, the autocomplete menu suggests adding a control when relevant or when you type
?in the query. Select Create control.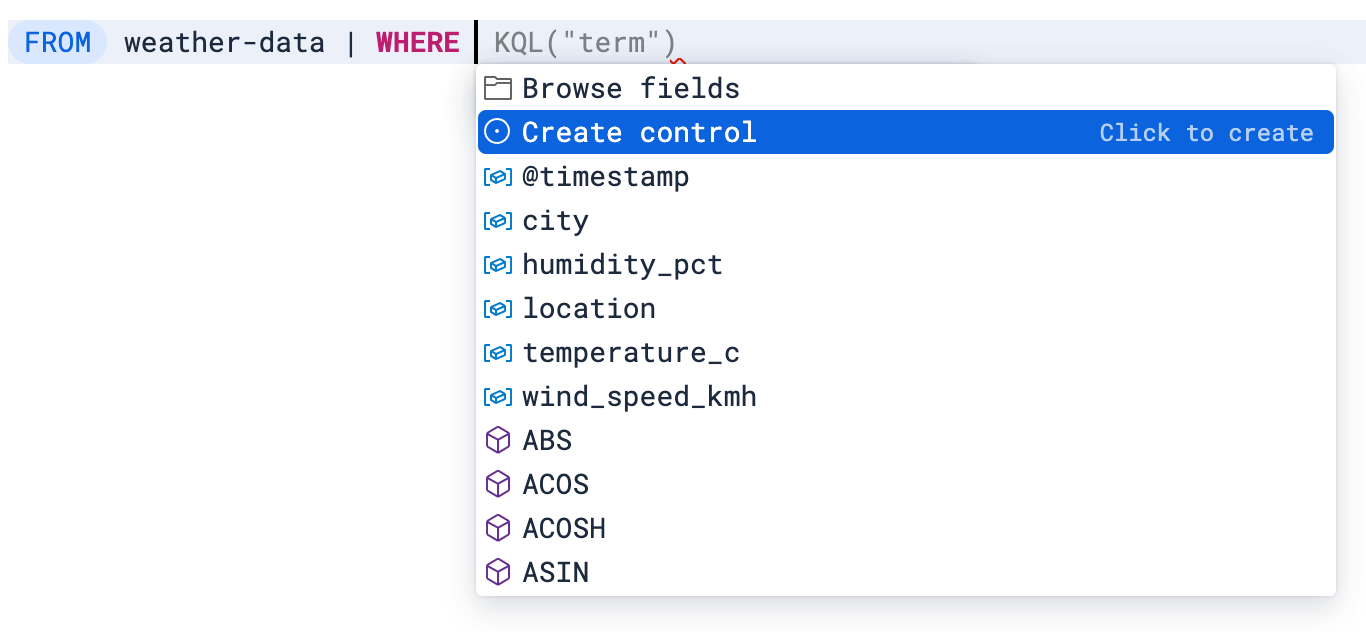
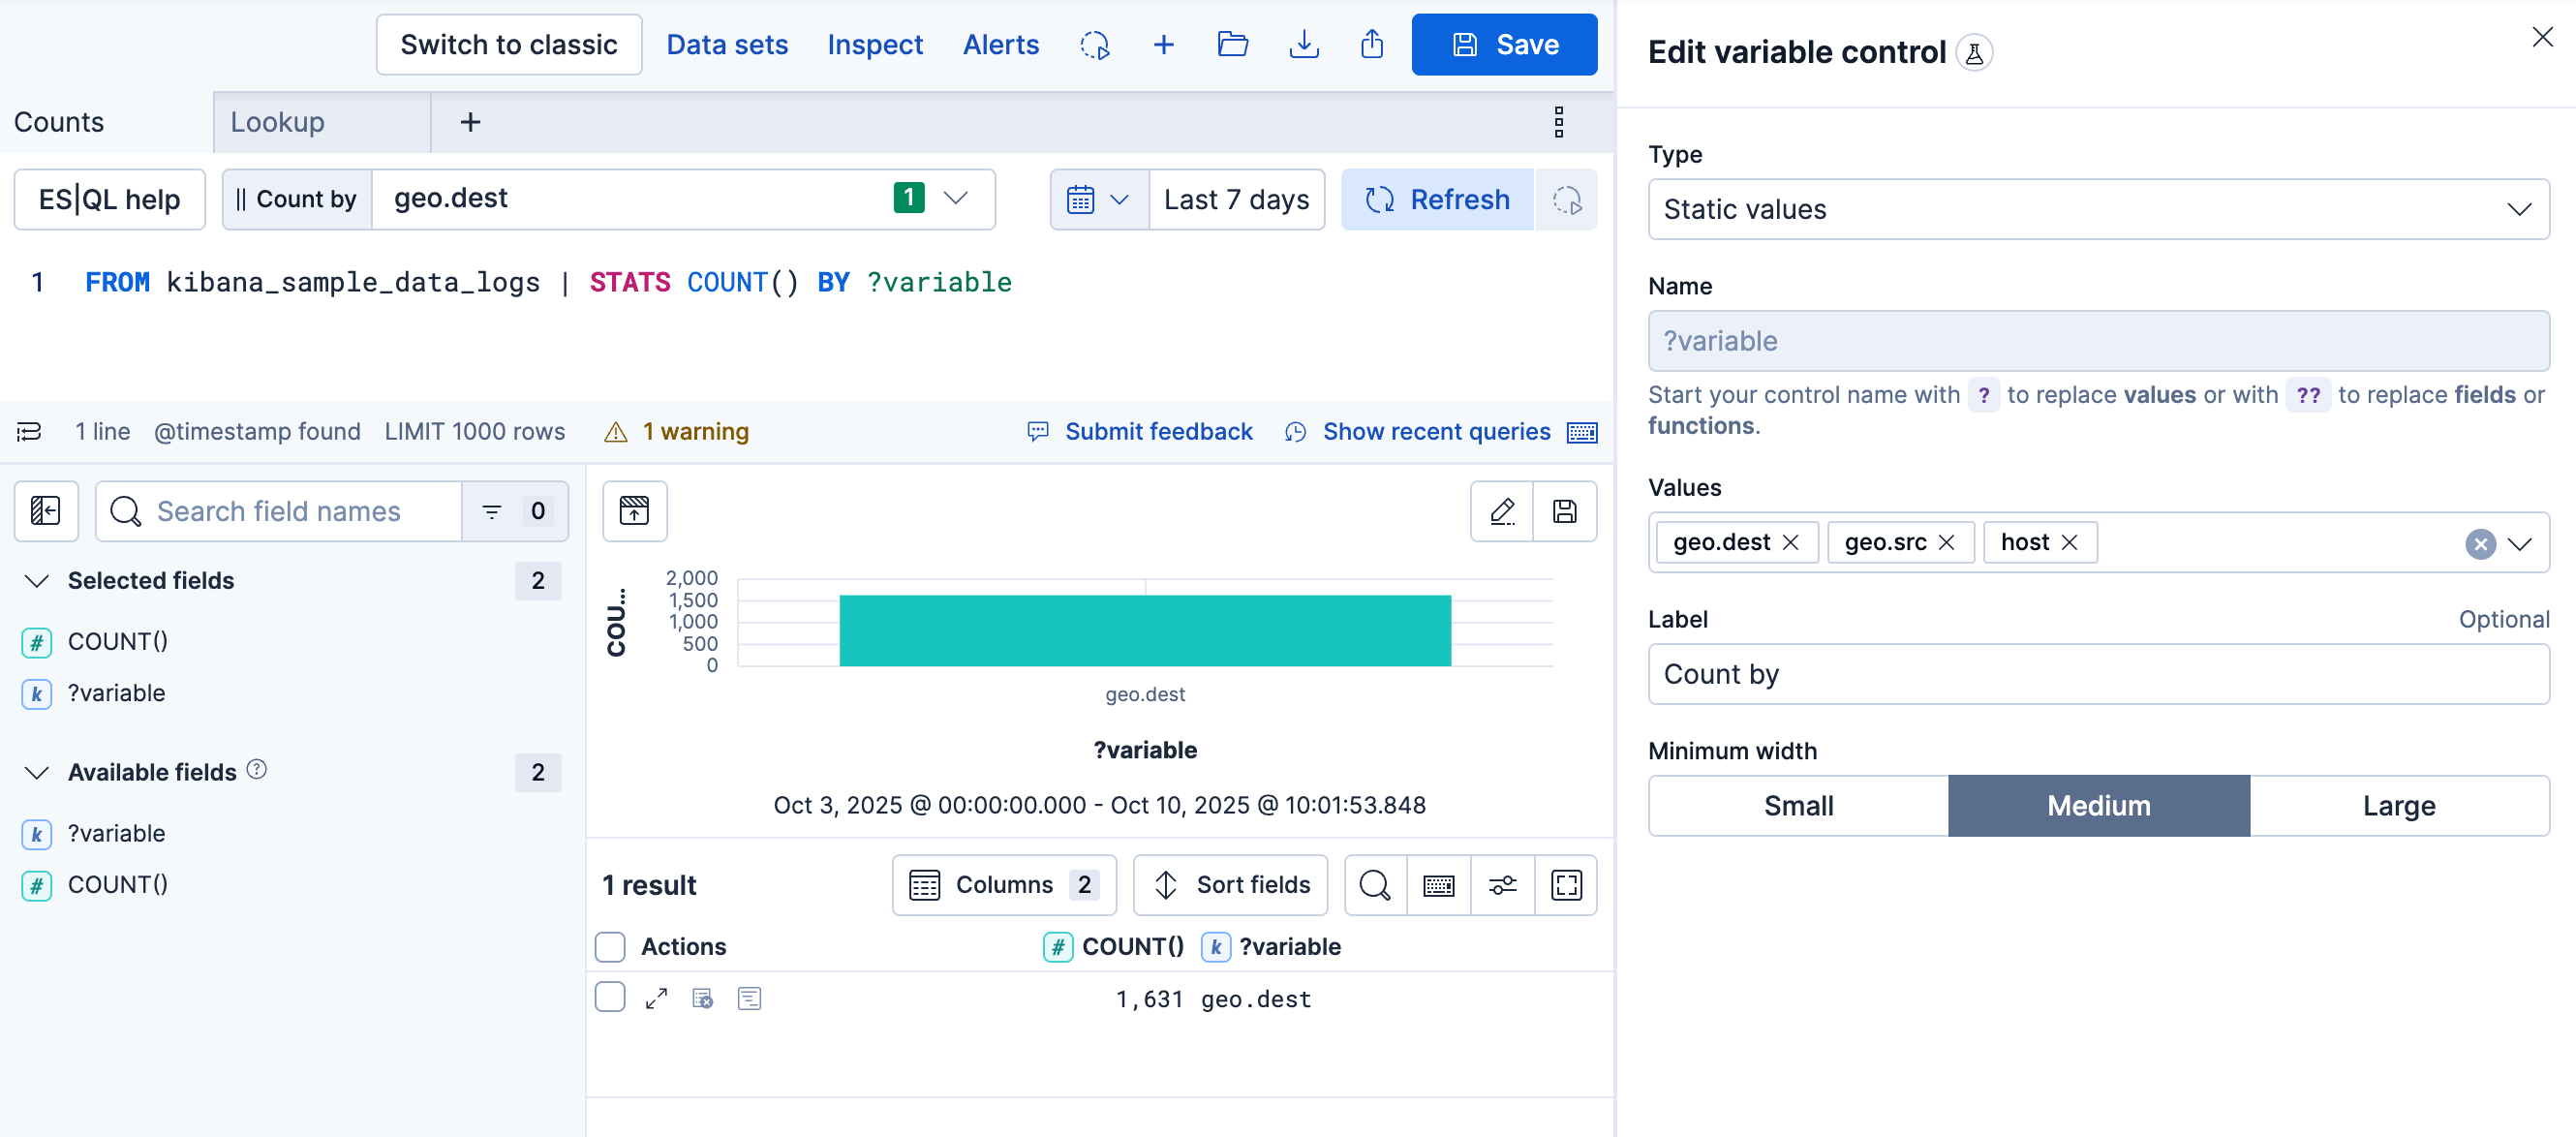
A flyout opens to let you configure the control. Specify:
The type of the control:
For controls with Static values, enter available values manually or select them from the dropdown list.
For controls with Values from a query, write an ES|QL query to populate the list of options. Use this option to dynamically retrieve control values or to set up chained controls.
Tip - Only display values available for the selected time rangeTo restrict the options to values that exist within the selected time range, add
WHERE @timestamp <= ?_tend AND @timestamp > ?_tstartto the control's query. If your indices don't have a@timestampfield, use custom time parameters instead.
The name of the control. You use this name to reference the control in ES|QL queries.
- Start the name with
?for options that are static values. -
Start the name with ??for options that are fields or functions.
- Start the name with
The values users can select. You can add multiple values from suggested fields or type in custom values. If you selected Values from a query, write an ES|QL query instead.
The label of the control. This is the label displayed in Discover or in the dashboard.
Whether the control allows a single selection or multiple selections. Multiple selections require using the MV_CONTAINSorMV_INTERSECTSfunctions in your query.
Save the control.
The control is created. If you created it while editing a query, its variable is inserted into that query, which you can keep editing.
Examples
Filter by a selected value:
| WHERE field == ?valueGroup by a selected field:
| STATS count = COUNT(*) BY ??fieldAdjust a function setting, such as a date histogram interval:
| STATS count = COUNT(*) BY BUCKET(@timestamp, ?interval)Switch the aggregation function:
| STATS metric = ??function
Result: The control appears for the query, and its variable is inserted where you created it.
You can create controls that let users select multiple values. To do that:
Add the
MV_CONTAINSfunction to your query, with the field as the first parameter (superset) and a variable as the second parameter (subset). For example:FROM logs-* | WHERE MV_CONTAINS(field, ?values)NoteMulti-selection is only available for
?valuesvariables, not for??fieldsor??functionsvariables.MV_CONTAINSchecks that all subset values are present. UseMV_INTERSECTSinstead if matching any subset value is enough.When defining the control, select the Allow multiple selections option.
Save the control.
The newly configured control becomes available and allows users to select multiple values.
Once a control is active for your query, you can still edit it by hovering over it and by selecting the Edit option that appears.
You can edit all the options described in Add variable controls to Discover queries > Add variable controls to your Discover queries.
When you save your edits, the control is updated for your query.
To add the results of your Discover explorations to a dashboard in a way that preserves the controls created from Discover and also adds them to the dashboard, you have two methods:
Method 1: Adding the Discover session's results
This method allows you to add the result table of your Discover ES|QL query to any dashboard.
Save the ES|QL query containing the variable control into a Discover session. If your Discover session contains several tabs:
-
You can choose which tab the panel displays after adding the session to a dashboard. -
Only the first tab is imported to the dashboard.
-
Go to Dashboards and open or create one.
Select Add, then From library.
Find and select the Discover session you saved earlier.
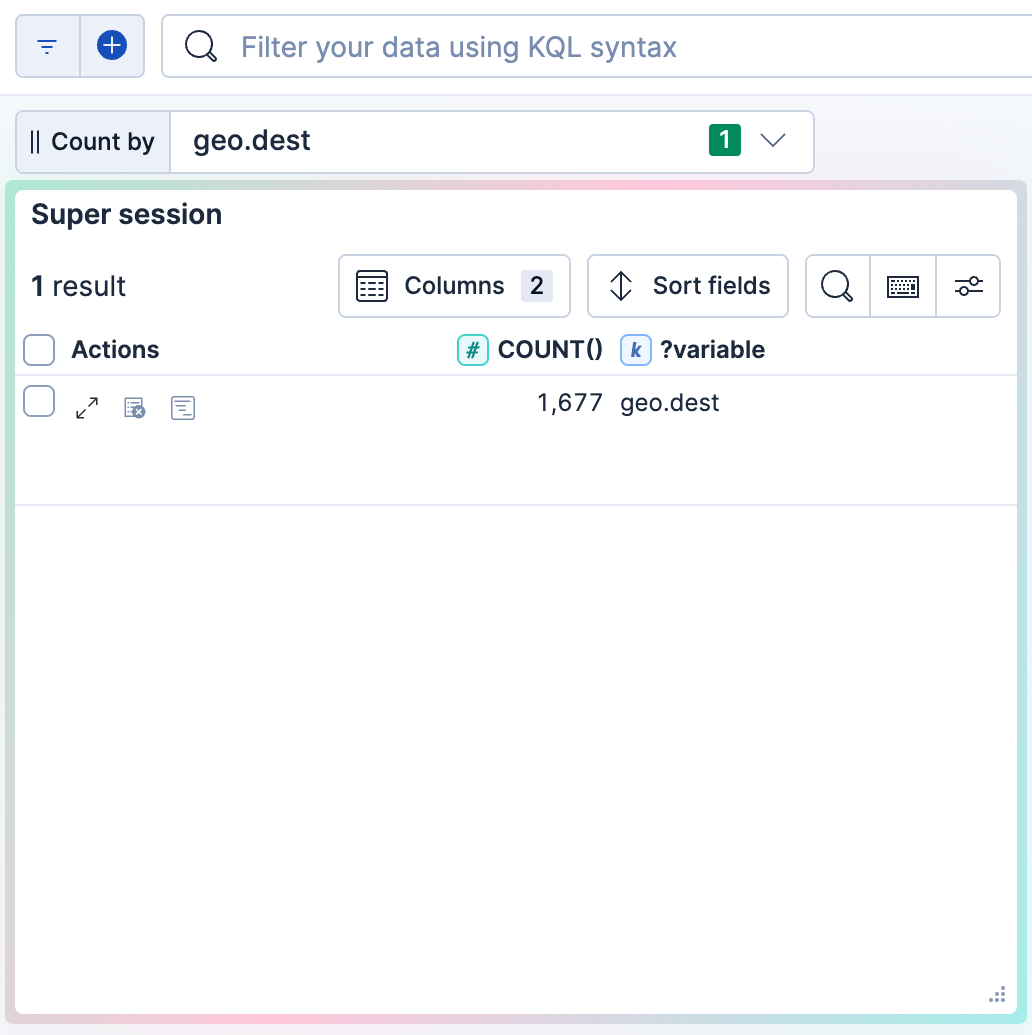
A new panel appears on the dashboard with the results of the query along with any attached controls.
Method 2: Adding the Discover visualization
This method allows you to add the visualization of your Discover ES|QL query to any dashboard.
Next to the Discover visualization, select Save visualization to dashboard (or Save visualization in earlier versions).

Select the dashboard to add the visualization to. You can choose an existing dashboard or create one.
The selected dashboard opens. It now includes a new panel that shows the visualization imported from Discover. Existing controls from the initial query in Discover are also added. You can find them at the top of the dashboard.