Get started with ES|QL Data Federation
This guide walks you through connecting Elasticsearch to external data and querying it with ES|QL. By the end, you have a working data source, a dataset, and a query returning results from external storage.
The example uses the Ookla Open Speedtest dataset (GitHub), a publicly accessible collection of internet performance metrics aggregated by geographic tile (a small area on the map). It mirrors a common observability pattern: analyzing network performance data stored in cloud storage alongside operational data indexed in Elasticsearch. Because the bucket allows anonymous access, you can follow along without AWS credentials.
This feature is experimental. It is not intended for production use and there are no guarantees around performance, scale, or stability in this release.
Make sure you have the following:
- An Elasticsearch deployment running version 9.5 or later, with ES|QL Data Federation enabled.
- An Enterprise subscription for Elastic Cloud Hosted, Elastic Cloud Enterprise, Elastic Cloud on Kubernetes, or self-managed deployments.
- The cluster
manageprivilege to create data sources. - The index
manageprivilege to create datasets.
This quickstart queries a public S3 bucket. If queries return 503 errors, the bucket may be temporarily throttled due to high traffic. Wait a few minutes and try again.
These steps walk you through registering a data source, creating a dataset, and querying federated data with ES|QL.
-
Register a data source
A data source defines the connection to an external storage system, including its type, endpoint, and credentials. Once registered, any number of datasets can reference it.
This example registers a data source that points at a public S3 bucket with anonymous access.
PUT /_query/data_source/ookla_speedtest{ "type": "s3", "settings": { "auth": "anonymous" } }- Enables anonymous access for public buckets. For private data, refer to the authentication overview.
A successful request returns
{"acknowledged": true}.curl -X PUT "${ELASTICSEARCH_URL}/_query/data_source/ookla_speedtest" \ -H "Authorization: ApiKey ${API_KEY}" \ -H "Content-Type: application/json" \ -d '{ "type": "s3", "settings": { "auth": "anonymous" } }'A successful request returns
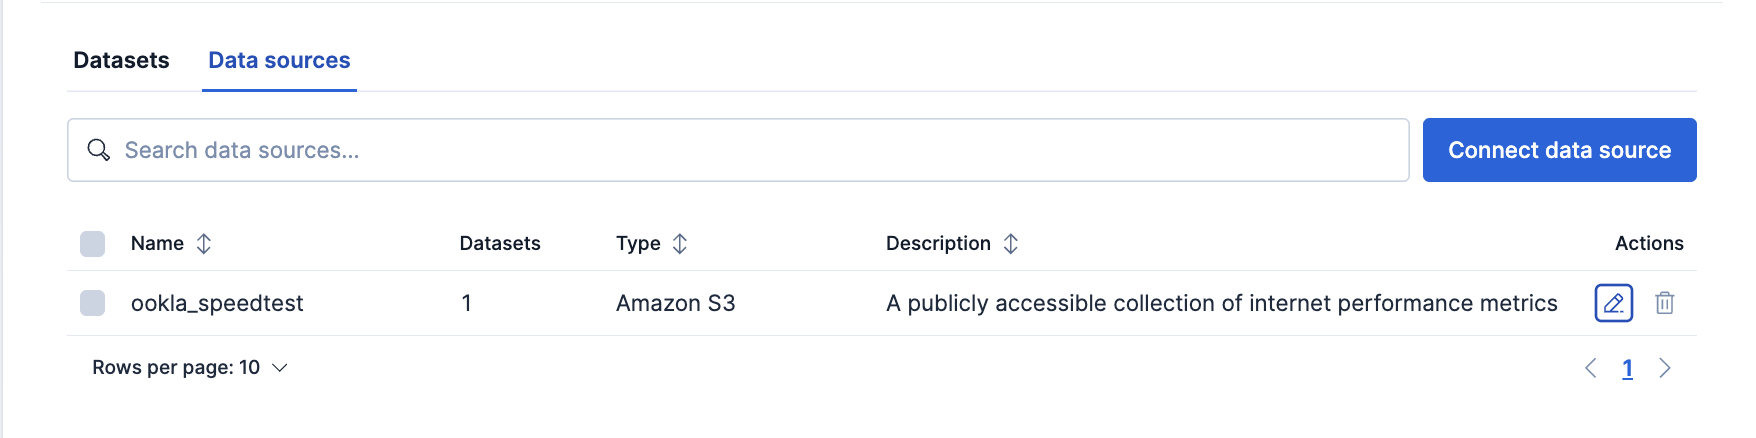
{"acknowledged": true}.- Go to Data management > ES|QL Data Federation.
- On the Data sources tab, click Connect data source.
- Set Data source type to Amazon S3.
- Enter
ookla_speedtestas the Name. - Under Authentication, from the Preferred method menu, select Anonymous.
- Click Connect.
Confirm the data source was created:
GET /_query/data_source/ookla_speedtestcurl -X GET "${ELASTICSEARCH_URL}/_query/data_source/ookla_speedtest" \ -H "Authorization: ApiKey ${API_KEY}"NoteCreating a data source does not validate connectivity to the external system. To verify that a data source is working, create a dataset that references it and run a query. If the credentials or endpoint are incorrect, the query returns an error.
-
Create a dataset
A dataset points at specific files within a data source and makes them queryable as a virtual index. It references a data source by name and specifies a resource path that identifies the files to read.
This example creates a dataset over one quarter of Ookla's fixed-broadband performance data. Each Parquet file contains speedtest results aggregated into geographic tiles. The key columns are:
avg_d_kbps,avg_u_kbps: average download and upload throughput per geographic tile, in kbpsavg_lat_ms: average latency per geographic tile, in millisecondstests,devices: number of speedtests and unique devices per geographic tile
For the full column reference, refer to the Ookla Open Data tile attributes.
PUT /_query/dataset/speedtest_fixed{ "data_source": "ookla_speedtest", "resource": "s3://ookla-open-data/parquet/performance/type=fixed/year=2024/quarter=1/*.parquet" }- The name of the data source to connect through.
- A glob pattern matching all Parquet files for Q1 2024 fixed-broadband tests. The
*wildcard matches any filename in that directory.
A successful request returns
{"acknowledged": true}.curl -X PUT "${ELASTICSEARCH_URL}/_query/dataset/speedtest_fixed" \ -H "Authorization: ApiKey ${API_KEY}" \ -H "Content-Type: application/json" \ -d '{ "data_source": "ookla_speedtest", "resource": "s3://ookla-open-data/parquet/performance/type=fixed/year=2024/quarter=1/*.parquet" }'A successful request returns
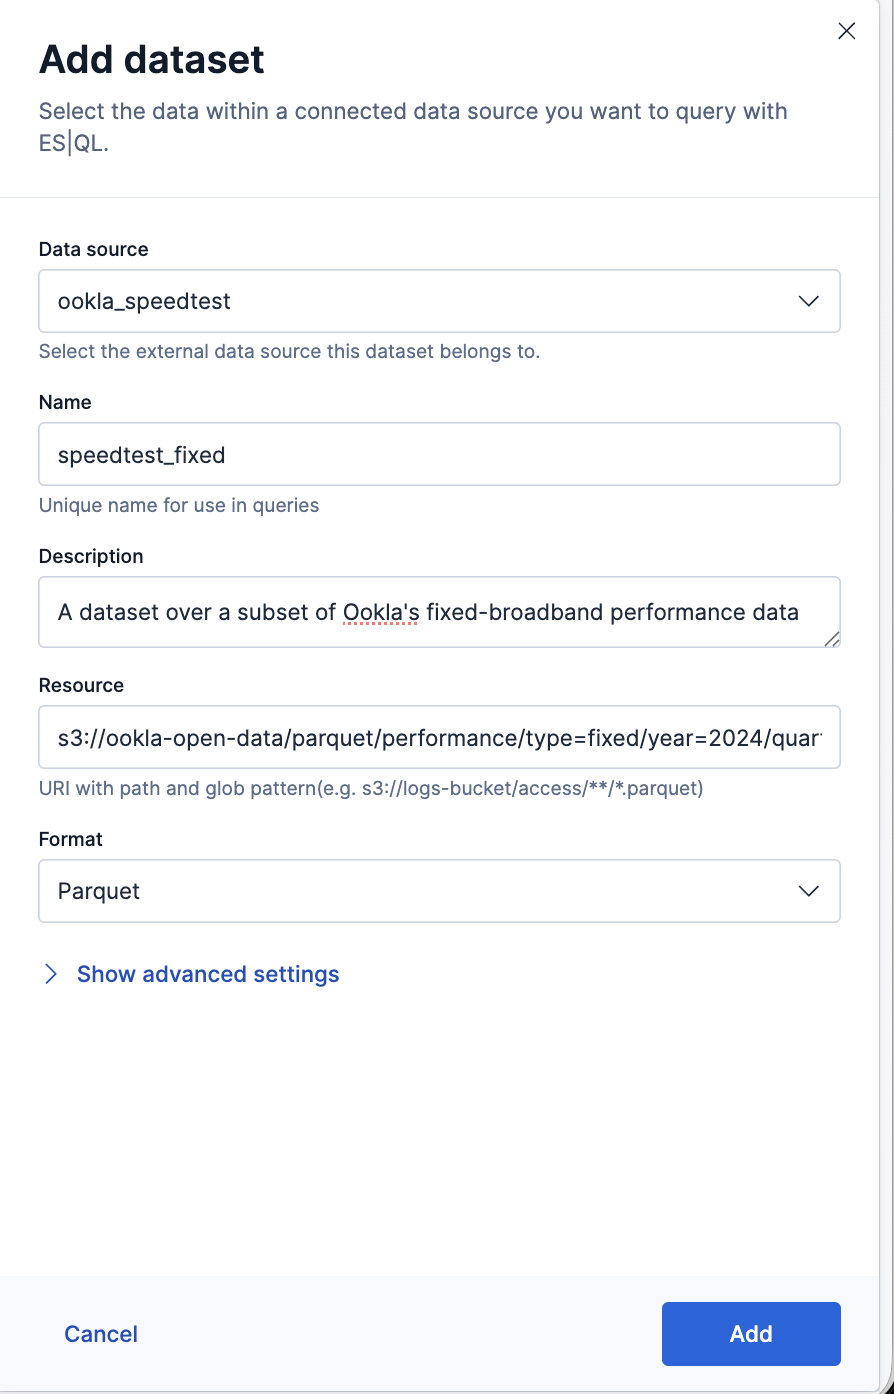
{"acknowledged": true}.Select the Datasets tab, then click Add dataset.
Select
ookla_speedtestas the Data source.Enter
speedtest_fixedas the Name.In Resource, enter the resource path that selects the files to read:
s3://ookla-open-data/parquet/performance/type=fixed/year=2024/quarter=1/*.parquetSet Format to Parquet.
Click Add.
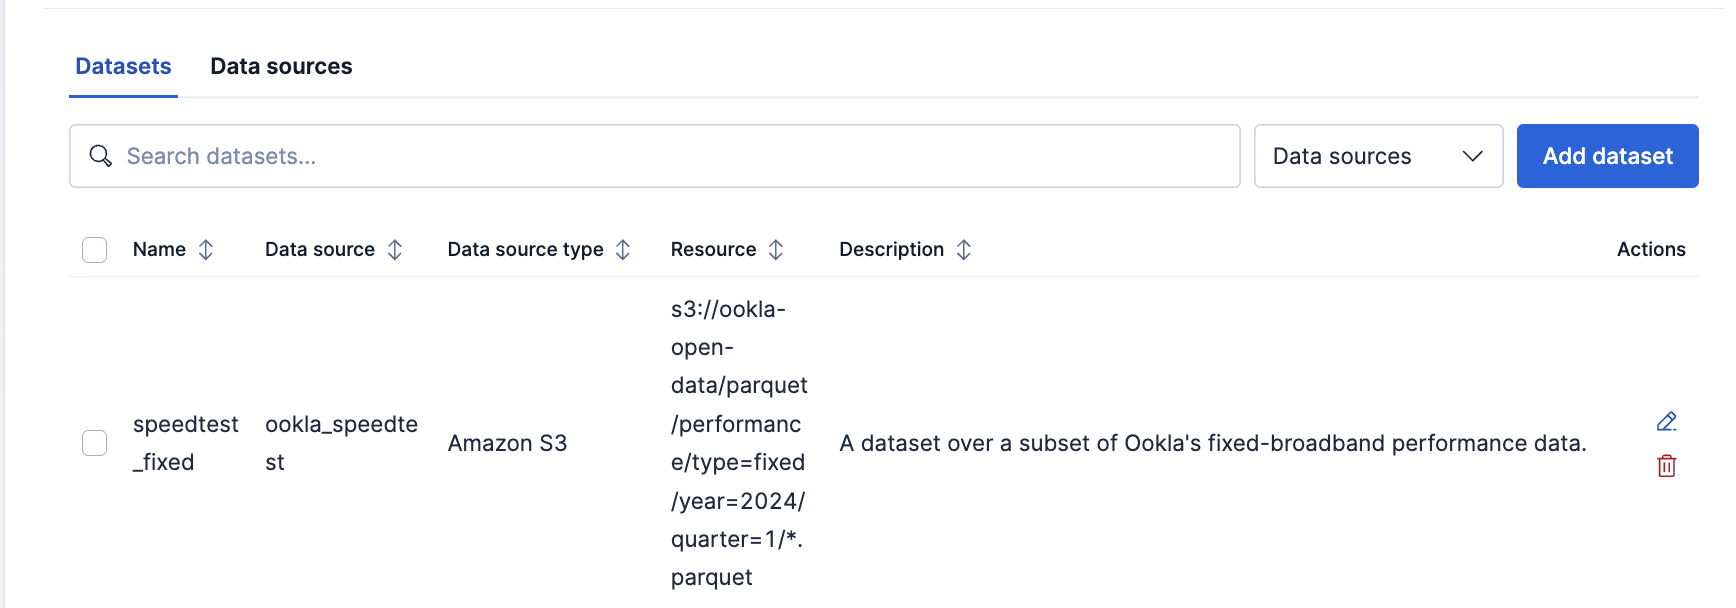
Show the completed Add dataset flyoutConfirm the dataset was created:
GET /_query/dataset/speedtest_fixedcurl -X GET "${ELASTICSEARCH_URL}/_query/dataset/speedtest_fixed" \ -H "Authorization: ApiKey ${API_KEY}" -
Check field mappings
Before writing queries, check what field mappings Elasticsearch inferred from the Parquet files. Query the dataset with
LIMIT 1to return a single row with all columns:POST /_query{ "query": "FROM speedtest_fixed | LIMIT 1" }curl -X POST "${ELASTICSEARCH_URL}/_query" \ -H "Authorization: ApiKey ${API_KEY}" \ -H "Content-Type: application/json" \ -d '{ "query": "FROM speedtest_fixed | LIMIT 1" }'FROM speedtest_fixed | LIMIT 1The response lists every column name and its inferred type:
View column names and types{ "name": "quadkey", "type": "keyword" } { "name": "tile", "type": "keyword" } { "name": "tile_x", "type": "double" } { "name": "tile_y", "type": "double" } { "name": "avg_d_kbps", "type": "long" } { "name": "avg_u_kbps", "type": "long" } { "name": "avg_lat_ms", "type": "long" } { "name": "avg_lat_down_ms", "type": "integer" } { "name": "avg_lat_up_ms", "type": "integer" } { "name": "tests", "type": "long" } { "name": "devices", "type": "long" } { "name": "type", "type": "keyword" } { "name": "year", "type": "integer" } { "name": "quarter", "type": "integer" }The
type,year, andquartercolumns come from Hive-style partition paths in the S3 bucket. Elasticsearch detects these automatically whenpartition_detectionis set toauto(the default).TipIf a column has an unexpected type, you can override it with a dataset mapping.
-
Run your first query
Once a dataset exists, query it with
FROMjust like any Elasticsearch index. This query selects the key performance columns and returns five rows:POST /_query{ "query": """ FROM speedtest_fixed | KEEP avg_d_kbps, avg_u_kbps, avg_lat_ms, tests | LIMIT 5 """ }curl -X POST "${ELASTICSEARCH_URL}/_query" \ -H "Authorization: ApiKey ${API_KEY}" \ -H "Content-Type: application/json" \ -d '{ "query": "FROM speedtest_fixed | KEEP avg_d_kbps, avg_u_kbps, avg_lat_ms, tests | LIMIT 5" }'FROM speedtest_fixed | KEEP avg_d_kbps, avg_u_kbps, avg_lat_ms, tests | LIMIT 5If the query returns results, your data source is working. You can now use the full range of ES|QL processing commands on this dataset.
-
Explore the data
Now that the dataset is working, try some more expressive queries.
Convert units and filter for the fastest geographic tiles
EVALcreates new columns from expressions. Here it converts the raw kbps values to Mbps usingROUND, thenWHEREfilters for geographic tiles with a meaningful sample size.KEEPselects only the columns you need in the output, which also reduces the data read from storage for Parquet files.POST /_query{ "query": """ FROM speedtest_fixed | EVAL download_mbps = ROUND(avg_d_kbps / 1000.0, 1), upload_mbps = ROUND(avg_u_kbps / 1000.0, 1) | WHERE tests > 100 | SORT download_mbps DESC | KEEP download_mbps, upload_mbps, avg_lat_ms, tests, devices | LIMIT 10 """ }curl -X POST "${ELASTICSEARCH_URL}/_query" \ -H "Authorization: ApiKey ${API_KEY}" \ -H "Content-Type: application/json" \ -d '{ "query": "FROM speedtest_fixed | EVAL download_mbps = ROUND(avg_d_kbps / 1000.0, 1), upload_mbps = ROUND(avg_u_kbps / 1000.0, 1) | WHERE tests > 100 | SORT download_mbps DESC | KEEP download_mbps, upload_mbps, avg_lat_ms, tests, devices | LIMIT 10" }'FROM speedtest_fixed | EVAL download_mbps = ROUND(avg_d_kbps / 1000.0, 1), upload_mbps = ROUND(avg_u_kbps / 1000.0, 1) | WHERE tests > 100 | SORT download_mbps DESC | KEEP download_mbps, upload_mbps, avg_lat_ms, tests, devices | LIMIT 10Break down speeds by test volume
CASEevaluates conditions in order and returns the first match, with the last argument as the default.STATS ... BYgroups the results and computes one row per bucket. You can nest scalar functions likeROUNDaround aggregate functions likeAVGin the same expression. This query buckets geographic tiles by how many tests they recorded and compares average speeds across buckets.POST /_query{ "query": """ FROM speedtest_fixed | EVAL download_mbps = avg_d_kbps / 1000.0 | EVAL bucket = CASE( tests < 10, "< 10 tests", tests < 100, "10-99 tests", tests < 1000, "100-999 tests", ">= 1000 tests") | STATS avg_download = ROUND(AVG(download_mbps), 1), avg_latency = ROUND(AVG(avg_lat_ms), 1), tile_count = COUNT(*) BY bucket | SORT avg_download DESC """ }curl -X POST "${ELASTICSEARCH_URL}/_query" \ -H "Authorization: ApiKey ${API_KEY}" \ -H "Content-Type: application/json" \ -d '{ "query": "FROM speedtest_fixed | EVAL download_mbps = avg_d_kbps / 1000.0 | EVAL bucket = CASE(tests < 10, \"< 10 tests\", tests < 100, \"10-99 tests\", tests < 1000, \"100-999 tests\", \">= 1000 tests\") | STATS avg_download = ROUND(AVG(download_mbps), 1), avg_latency = ROUND(AVG(avg_lat_ms), 1), tile_count = COUNT(*) BY bucket | SORT avg_download DESC" }'FROM speedtest_fixed | EVAL download_mbps = avg_d_kbps / 1000.0 | EVAL bucket = CASE( tests < 10, "< 10 tests", tests < 100, "10-99 tests", tests < 1000, "100-999 tests", ">= 1000 tests") | STATS avg_download = ROUND(AVG(download_mbps), 1), avg_latency = ROUND(AVG(avg_lat_ms), 1), tile_count = COUNT(*) BY bucket | SORT avg_download DESCAnalyze speed distributions with percentiles
MEDIANreturns the 50th percentile andPERCENTILE(field, 95)returns the value at the 95th percentile, showing the speed that only 5% of geographic tiles exceed. Together they reveal how speeds are distributed, not just the average.POST /_query{ "query": """ FROM speedtest_fixed | WHERE tests > 50 | STATS median_down = ROUND(MEDIAN(avg_d_kbps) / 1000.0, 1), p95_down = ROUND(PERCENTILE(avg_d_kbps, 95) / 1000.0, 1), median_latency = ROUND(MEDIAN(avg_lat_ms), 0), p95_latency = ROUND(PERCENTILE(avg_lat_ms, 95), 0), tiles = COUNT(*) """ }curl -X POST "${ELASTICSEARCH_URL}/_query" \ -H "Authorization: ApiKey ${API_KEY}" \ -H "Content-Type: application/json" \ -d '{ "query": "FROM speedtest_fixed | WHERE tests > 50 | STATS median_down = ROUND(MEDIAN(avg_d_kbps) / 1000.0, 1), p95_down = ROUND(PERCENTILE(avg_d_kbps, 95) / 1000.0, 1), median_latency = ROUND(MEDIAN(avg_lat_ms), 0), p95_latency = ROUND(PERCENTILE(avg_lat_ms, 95), 0), tiles = COUNT(*)" }'FROM speedtest_fixed | WHERE tests > 50 | STATS median_down = ROUND(MEDIAN(avg_d_kbps) / 1000.0, 1), p95_down = ROUND(PERCENTILE(avg_d_kbps, 95) / 1000.0, 1), median_latency = ROUND(MEDIAN(avg_lat_ms), 0), p95_latency = ROUND(PERCENTILE(avg_lat_ms, 95), 0), tiles = COUNT(*) -
Query federated and indexed data together
Datasets share the same namespace as regular indices, so you can query both in a single
FROM. This lets you combine external data with indexed data in a single query.First, create an index with a few sample documents to query alongside the dataset:
PUT /network_incidents{ "mappings": { "properties": { "category": { "type": "keyword" }, "severity": { "type": "keyword" }, "duration_min": { "type": "integer" } } } }curl -X PUT "${ELASTICSEARCH_URL}/network_incidents" \ -H "Authorization: ApiKey ${API_KEY}" \ -H "Content-Type: application/json" \ -d '{ "mappings": { "properties": { "category": { "type": "keyword" }, "severity": { "type": "keyword" }, "duration_min": { "type": "integer" } } } }'Then index a few documents:
POST /_bulk{"index":{"_index":"network_incidents"}} {"category":"outage","severity":"high","duration_min":45} {"index":{"_index":"network_incidents"}} {"category":"degradation","severity":"medium","duration_min":12} {"index":{"_index":"network_incidents"}} {"category":"outage","severity":"low","duration_min":8}curl -X POST "${ELASTICSEARCH_URL}/_bulk" \ -H "Authorization: ApiKey ${API_KEY}" \ -H "Content-Type: application/x-ndjson" \ -d ' {"index":{"_index":"network_incidents"}} {"category":"outage","severity":"high","duration_min":45} {"index":{"_index":"network_incidents"}} {"category":"degradation","severity":"medium","duration_min":12} {"index":{"_index":"network_incidents"}} {"category":"outage","severity":"low","duration_min":8} 'Now query both sources together.
FROMresolves each name independently, whether it is an index, data stream, alias, ES|QL view, or dataset. UseMETADATA _indexto see where each row came from:POST /_query{ "query": """ FROM speedtest_fixed, network_incidents METADATA _index | KEEP _index, category, severity, duration_min, avg_d_kbps, avg_lat_ms | SORT _index ASC, duration_min DESC NULLS LAST | LIMIT 5 """ }curl -X POST "${ELASTICSEARCH_URL}/_query" \ -H "Authorization: ApiKey ${API_KEY}" \ -H "Content-Type: application/json" \ -d '{ "query": "FROM speedtest_fixed, network_incidents METADATA _index | KEEP _index, category, severity, duration_min, avg_d_kbps, avg_lat_ms | SORT _index ASC, duration_min DESC NULLS LAST | LIMIT 5" }'FROM speedtest_fixed, network_incidents METADATA _index | KEEP _index, category, severity, duration_min, avg_d_kbps, avg_lat_ms | SORT _index ASC, duration_min DESC NULLS LAST | LIMIT 5The
_indexcolumn shows where each row came from. Columns that do not exist in a given source returnnull. The speedtest values in your results will differ. Execution metadata is omitted here:{ "columns": [ { "name": "_index", "type": "keyword" }, { "name": "category", "type": "keyword" }, { "name": "severity", "type": "keyword" }, { "name": "duration_min", "type": "integer" }, { "name": "avg_d_kbps", "type": "long" }, { "name": "avg_lat_ms", "type": "long" } ], "values": [ ["network_incidents", "outage", "high", 45, null, null], ["network_incidents", "degradation", "medium", 12, null, null], ["network_incidents", "outage", "low", 8, null, null], ["speedtest_fixed", null, null, null, 158062, 223], ["speedtest_fixed", null, null, null, 64266, 165] ] }
The quickstart uses a public bucket with anonymous access. To connect to a private bucket, supply credentials when registering the data source. Several authentication methods are available. For example, using static credentials:
				PUT /_query/data_source/my_s3_logs
					{
  "type": "s3",
  "description": "Production logs bucket",
  "settings": {
    "auth": "static_credentials",
    "access_key": "<AWS_ACCESS_KEY_ID>",
    "secret_key": "<AWS_SECRET_ACCESS_KEY>"
  }
}
When a data source includes credentials, Elasticsearch encrypts them before storing them in the cluster state, using the cluster state encryption key. This key is available automatically in most deployments. If it is not available, a request that includes credentials returns a 503 error. Refer to credential encryption for details.
Credential values are never returned in API responses. When you retrieve a data source, secrets are replaced by ::es_redacted::.
To remove the resources created in this guide, delete the dataset first because a data source cannot be deleted while datasets reference it. Then delete the data source and the sample index:
				DELETE /_query/dataset/speedtest_fixed
				DELETE /_query/data_source/ookla_speedtest
				DELETE /network_incidents
curl -X DELETE "${ELASTICSEARCH_URL}/_query/dataset/speedtest_fixed" \
  -H "Authorization: ApiKey ${API_KEY}"

curl -X DELETE "${ELASTICSEARCH_URL}/_query/data_source/ookla_speedtest" \
  -H "Authorization: ApiKey ${API_KEY}"

curl -X DELETE "${ELASTICSEARCH_URL}/network_incidents" \
  -H "Authorization: ApiKey ${API_KEY}"
Now that you have a working data source and dataset, you can:
- Learn about querying external datasets. To learn how the query engine reads external data, refer to query external datasets.
- For general ES|QL query tuning, refer to optimize ES|QL query performance.
- Connect your own bucket. To connect a private bucket with credentials or federated identity, refer to connect external data sources.
- Tune dataset settings. To override file formats, customize schema inference, or declare explicit column mappings, refer to select external datasets.
- Query your dataset in Kibana. Datasets work like indices in Discover, Dashboards, and other apps that use the ES|QL editor. To find your datasets while writing a query, refer to browse indices and fields from the editor.