Quickstart: Monitor your Kubernetes cluster with Elastic Agent
In this quickstart guide, you’ll learn how to create the Kubernetes resources that are required to monitor your cluster infrastructure.
This new approach requires minimal configuration and provides you with an easy setup to monitor your infrastructure. You no longer need to download, install, or configure the Elastic Agent, everything happens automatically when you run the kubectl command.
The kubectl command installs the standalone Elastic Agent in your Kubernetes cluster, downloads all the Kubernetes resources needed to collect metrics from the cluster, and sends it to Elastic.
An Elasticsearch cluster for storing and searching your data, and Kibana for visualizing and managing your data. This quickstart is available for all Elastic deployment models. To get started quickly, try out Elastic Cloud.
A user with the
superuserbuilt-in role or the privileges required to onboard data.A running Kubernetes cluster.
- An Elastic Observability Serverless project. To learn more, refer to Create an Observability project.
- A user with the Admin role or higher—required to onboard system logs and metrics. To learn more, refer to Assign user roles and privileges.
- A running Kubernetes cluster.
- Kubectl.
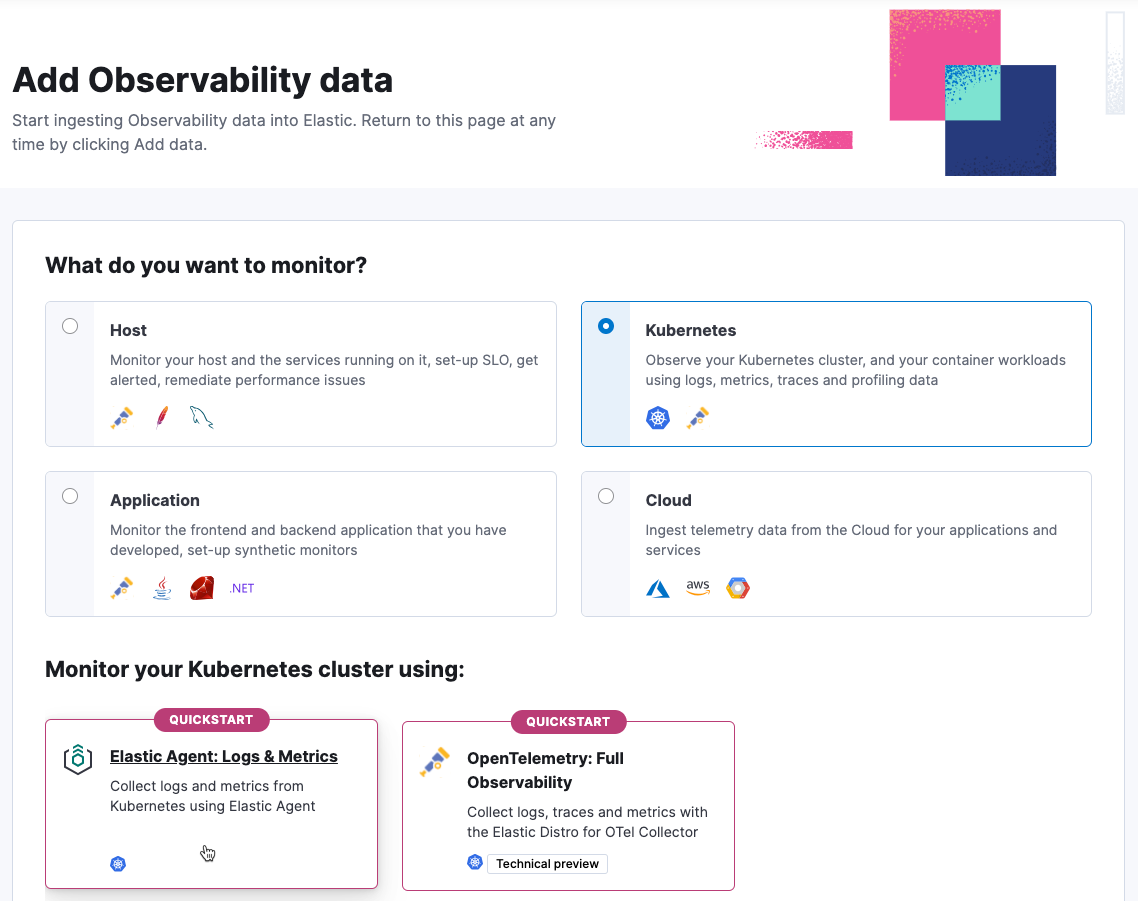
In Kibana, go to the Observability UI and click Add Data.
Under What do you want to monitor? select Kubernetes, and then select Elastic Agent: Logs & Metrics.

To install the Elastic Agent on your host, copy and run the install command.
You will use the kubectl command to download a manifest file, inject user’s API key generated by Kibana, and create the Kubernetes resources.
Go back to the Add Observability Data page.
There might be a slight delay before data is ingested. When ready, you will see the message We are monitoring your cluster.
Click Explore Kubernetes cluster to navigate to dashboards and explore your data.
Create a new Elastic Observability Serverless project, or open an existing one.
In your Elastic Observability Serverless project, go to Add Data.
Under What do you want to monitor? select Kubernetes, and then select Elastic Agent: Logs & Metrics.
To install the Elastic Agent on your host, copy and run the install command.
You will use the kubectl command to download a manifest file, inject user’s API key generated by Kibana, and create the Kubernetes resources.
Go back to the Add Observability Data page. There might be a slight delay before data is ingested. When ready, you will see the message We are monitoring your cluster.
Click Explore Kubernetes cluster to navigate to dashboards and explore your data.
After installation is complete and all relevant data is flowing into Elastic, the Visualize your data section allows you to access the Kubernetes Cluster Overview dashboard that can be used to monitor the health of the cluster.
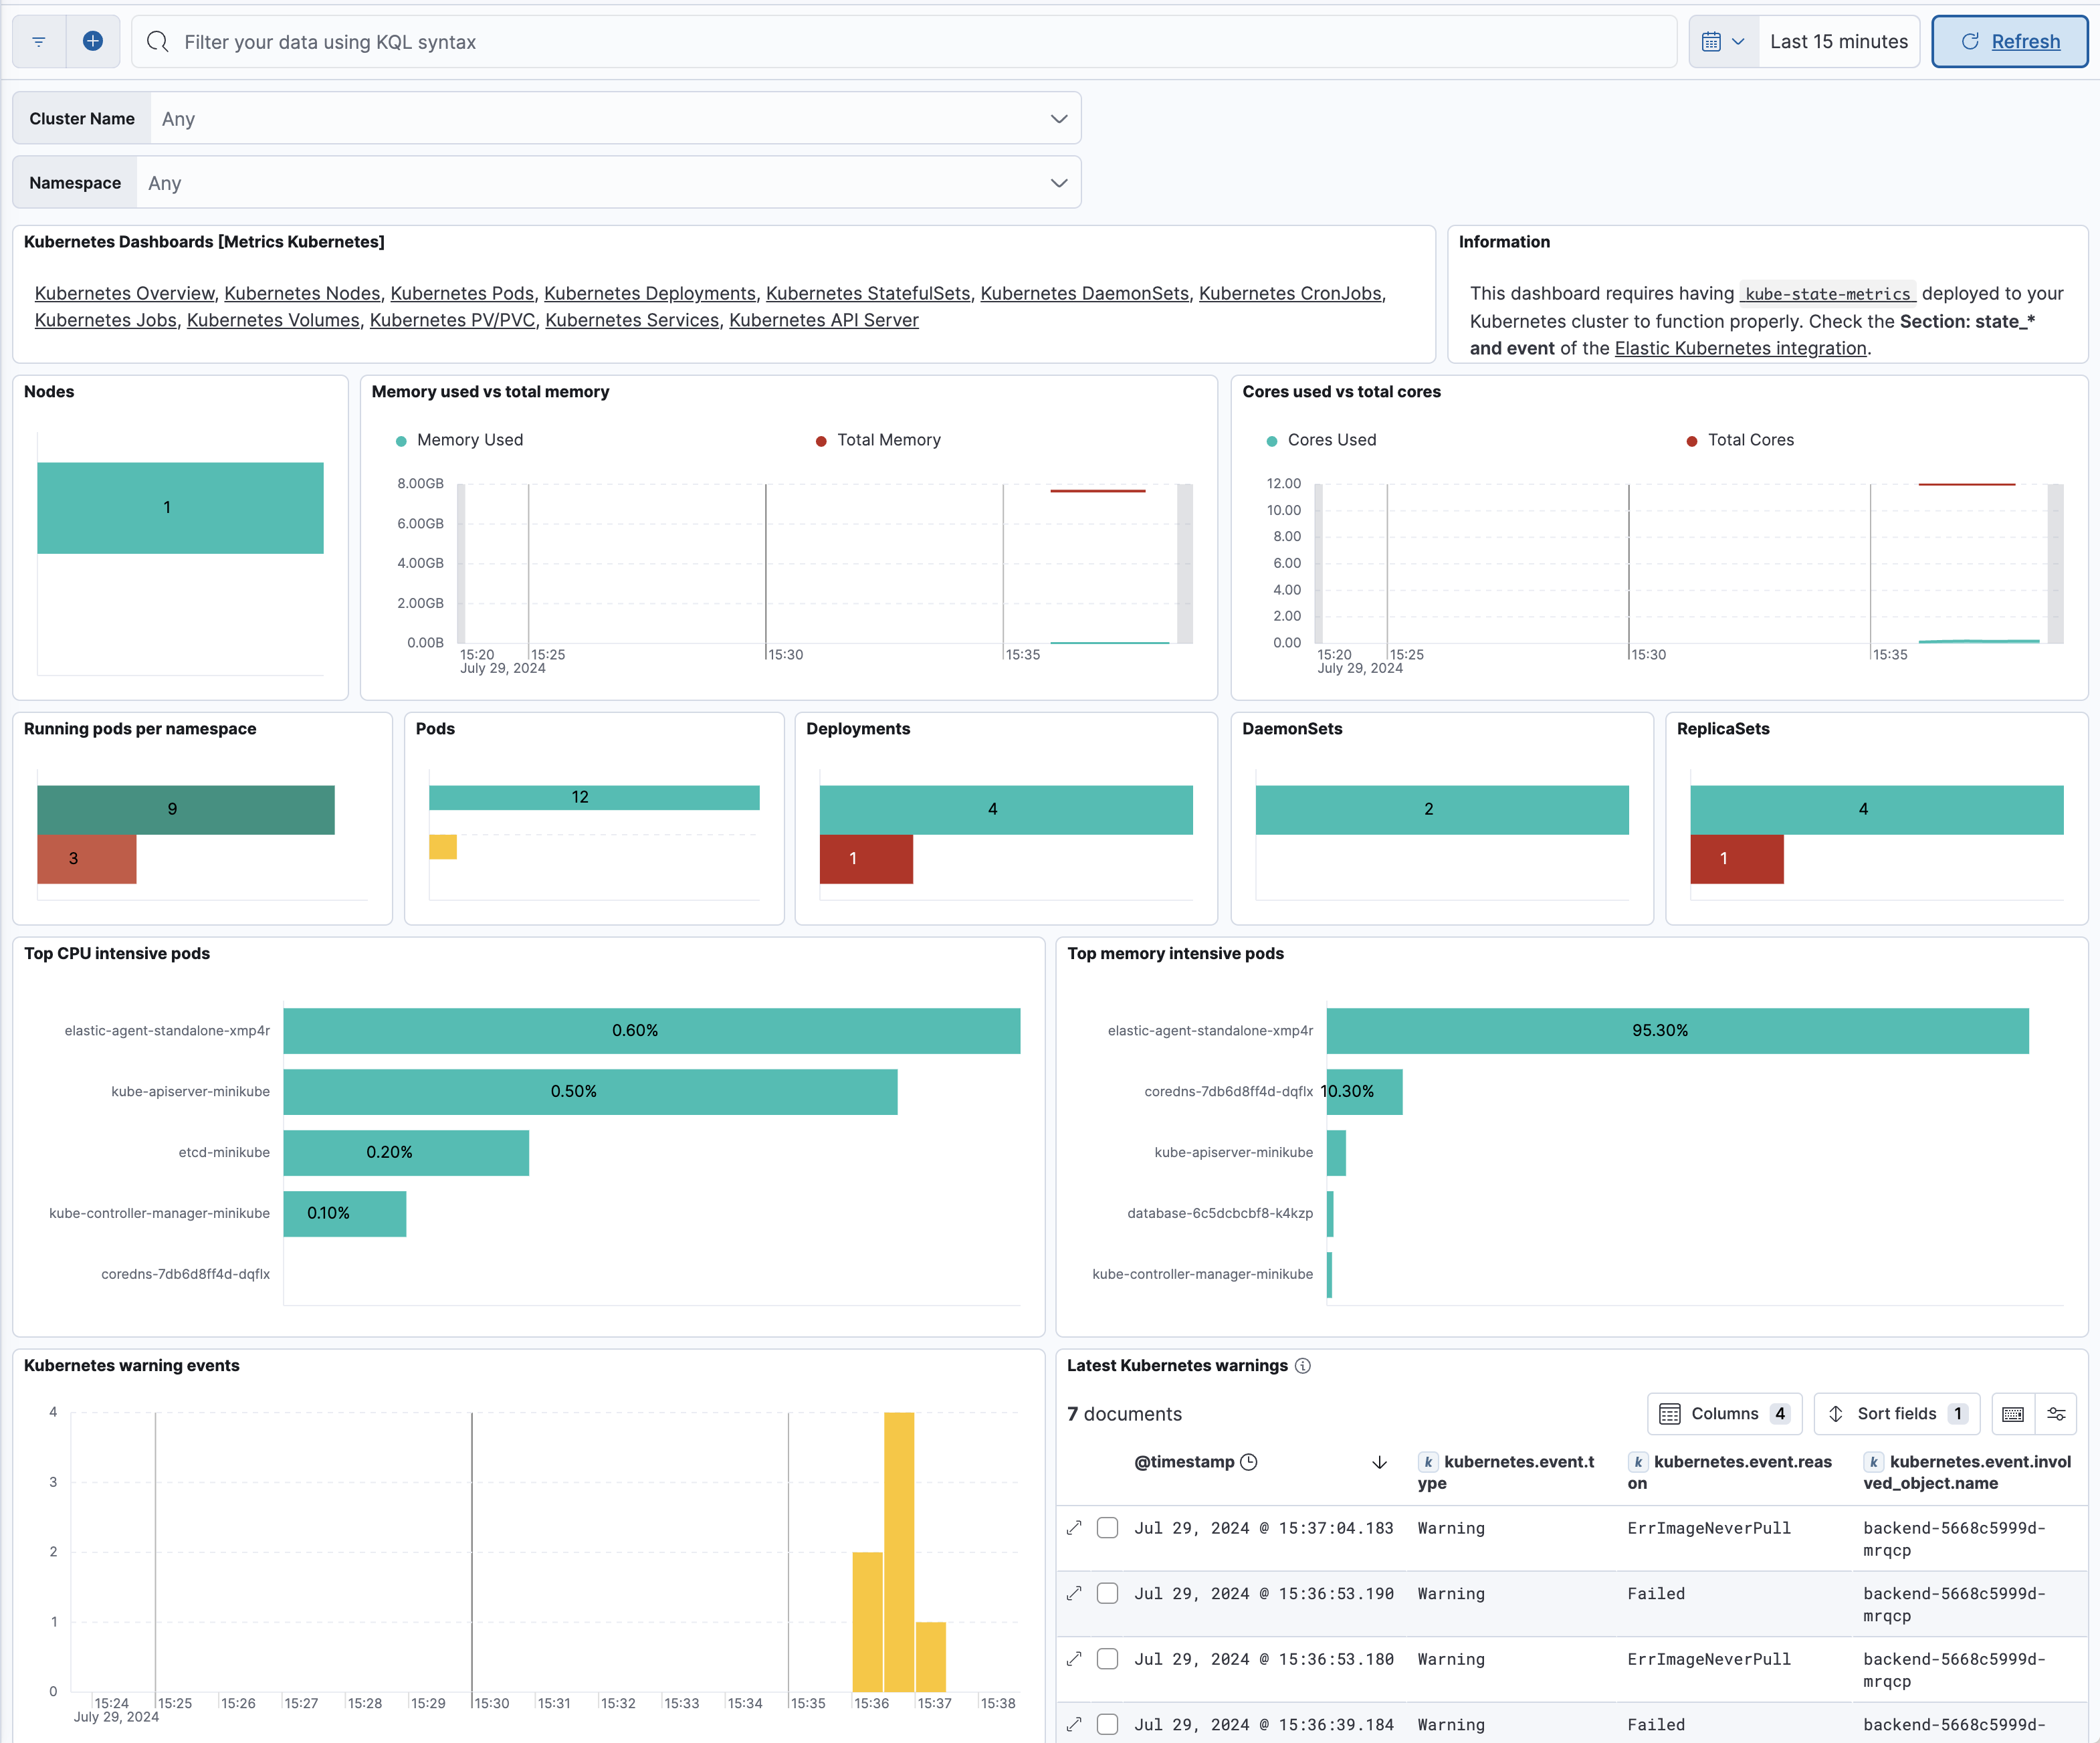
Furthermore, you can access other useful prebuilt dashboards for monitoring Kubernetes resources, for example running pods per namespace, as well as the resources they consume, like CPU and memory.
Refer to Observability overview for a description of other useful features.