Analyze and compare hosts
We’d love to get your feedback! Tell us what you think!
The Hosts page provides a metrics-driven view of your infrastructure backed by an easy-to-use interface called Lens. On the Hosts page, you can view health and performance metrics to help you quickly:
- Analyze and compare hosts without having to build new dashboards.
- Identify which hosts trigger the most alerts.
- Troubleshoot and resolve issues quickly.
- View historical data to rule out false alerts and identify root causes.
- Filter and search the data to focus on the hosts you care about the most.
To open Hosts, find Infrastructure in the main menu or use the global search field.
To learn more about the metrics shown on this page, refer to the Metrics reference documentation.
Don’t see any metrics?
If you haven’t added data yet, click Add data to search for and install an Elastic integration.
Need help getting started? Follow the steps in Get started with system metrics.
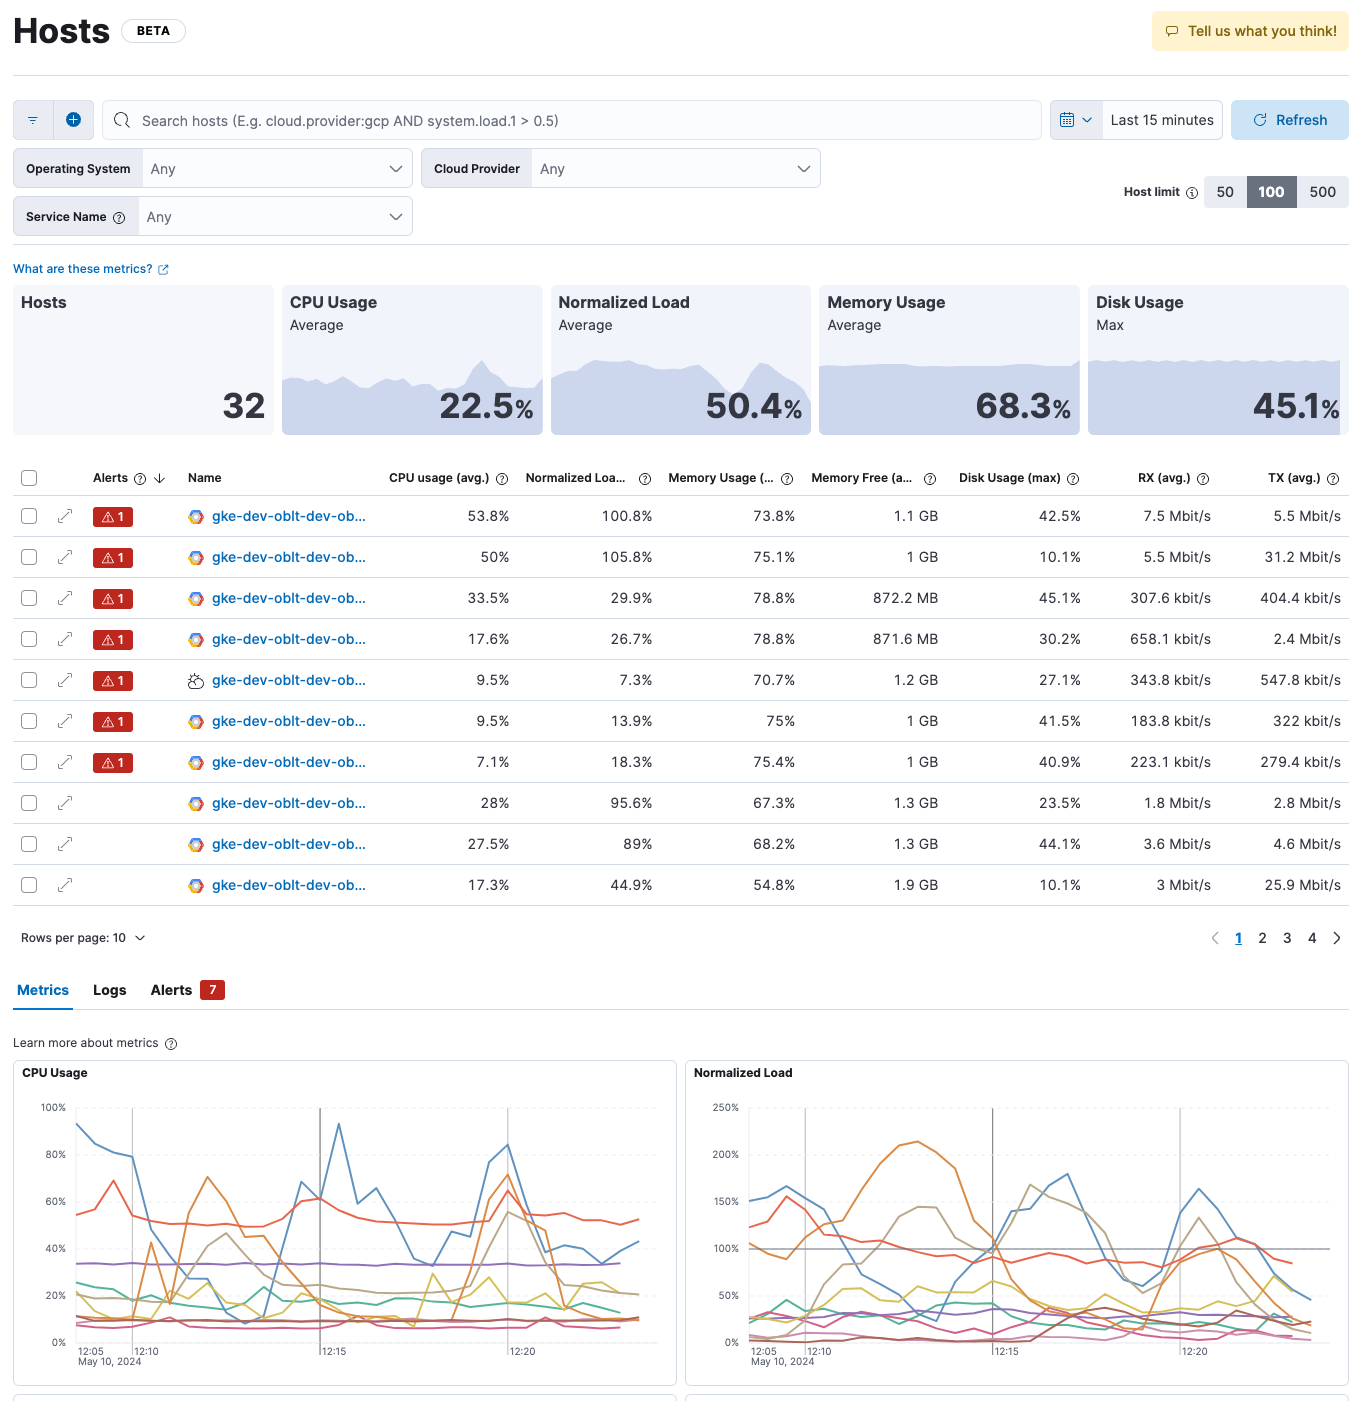
The Hosts page provides several ways to view host metrics:
- Overview tiles show the number of hosts returned by your search plus averages of key metrics, including CPU usage, normalized load, and memory usage. Max disk usage is also shown.
- The Host limit controls the maximum number of hosts shown on the page. The default is 50, which means the page shows data for the top 50 hosts based on the most recent timestamps. You can increase the host limit to see data for more hosts, but doing so may impact query performance.
- The Hosts table shows a breakdown of metrics for each host along with an alert count for any hosts with active alerts. You may need to page through the list or change the number of rows displayed on each page to see all of your hosts.
- Each host name is an active link to a host details page, where you can explore enhanced metrics and other observability data related to the selected host.
- Table columns are sortable, but note that the sorting behavior is applied to the already returned data set.
- The tabs at the bottom of the page show an overview of the metrics, logs, and alerts for all hosts returned by your search.
For more information about creating and viewing alerts, refer to Alerting.
The Hosts page provides several mechanisms for filtering the data on the page:
Enter a search query using Kibana Query Language to show metrics that match your search criteria. For example, to see metrics for hosts running on linux, enter
host.os.type : "linux". Otherwise you’ll see metrics for all your monitored hosts (up to the number of hosts specified by the host limit).Select additional criteria to filter the view:
In the Operating System list, select one or more operating systems to include (or exclude) metrics for hosts running the selected operating systems.
In the Cloud Provider list, select one or more cloud providers to include (or exclude) metrics for hosts running on the selected cloud providers.
In the Service Name list, select one or more service names to include (or exclude) metrics for the hosts running the selected services. Services must be instrumented by APM to be filterable. This filter is useful for comparing different hosts to determine whether a problem lies with a service or the host that it is running on.
TipFiltered results are sorted by document count. Document count is the number of events received by Elastic for the hosts that match your filter criteria.
Change the date range in the time filter, or click and drag on a visualization to change the date range.
Within a visualization, click a point on a line and apply filters to set other visualizations on the page to the same time and/or host.
To learn more about filtering data in Kibana, refer to Kibana concepts.
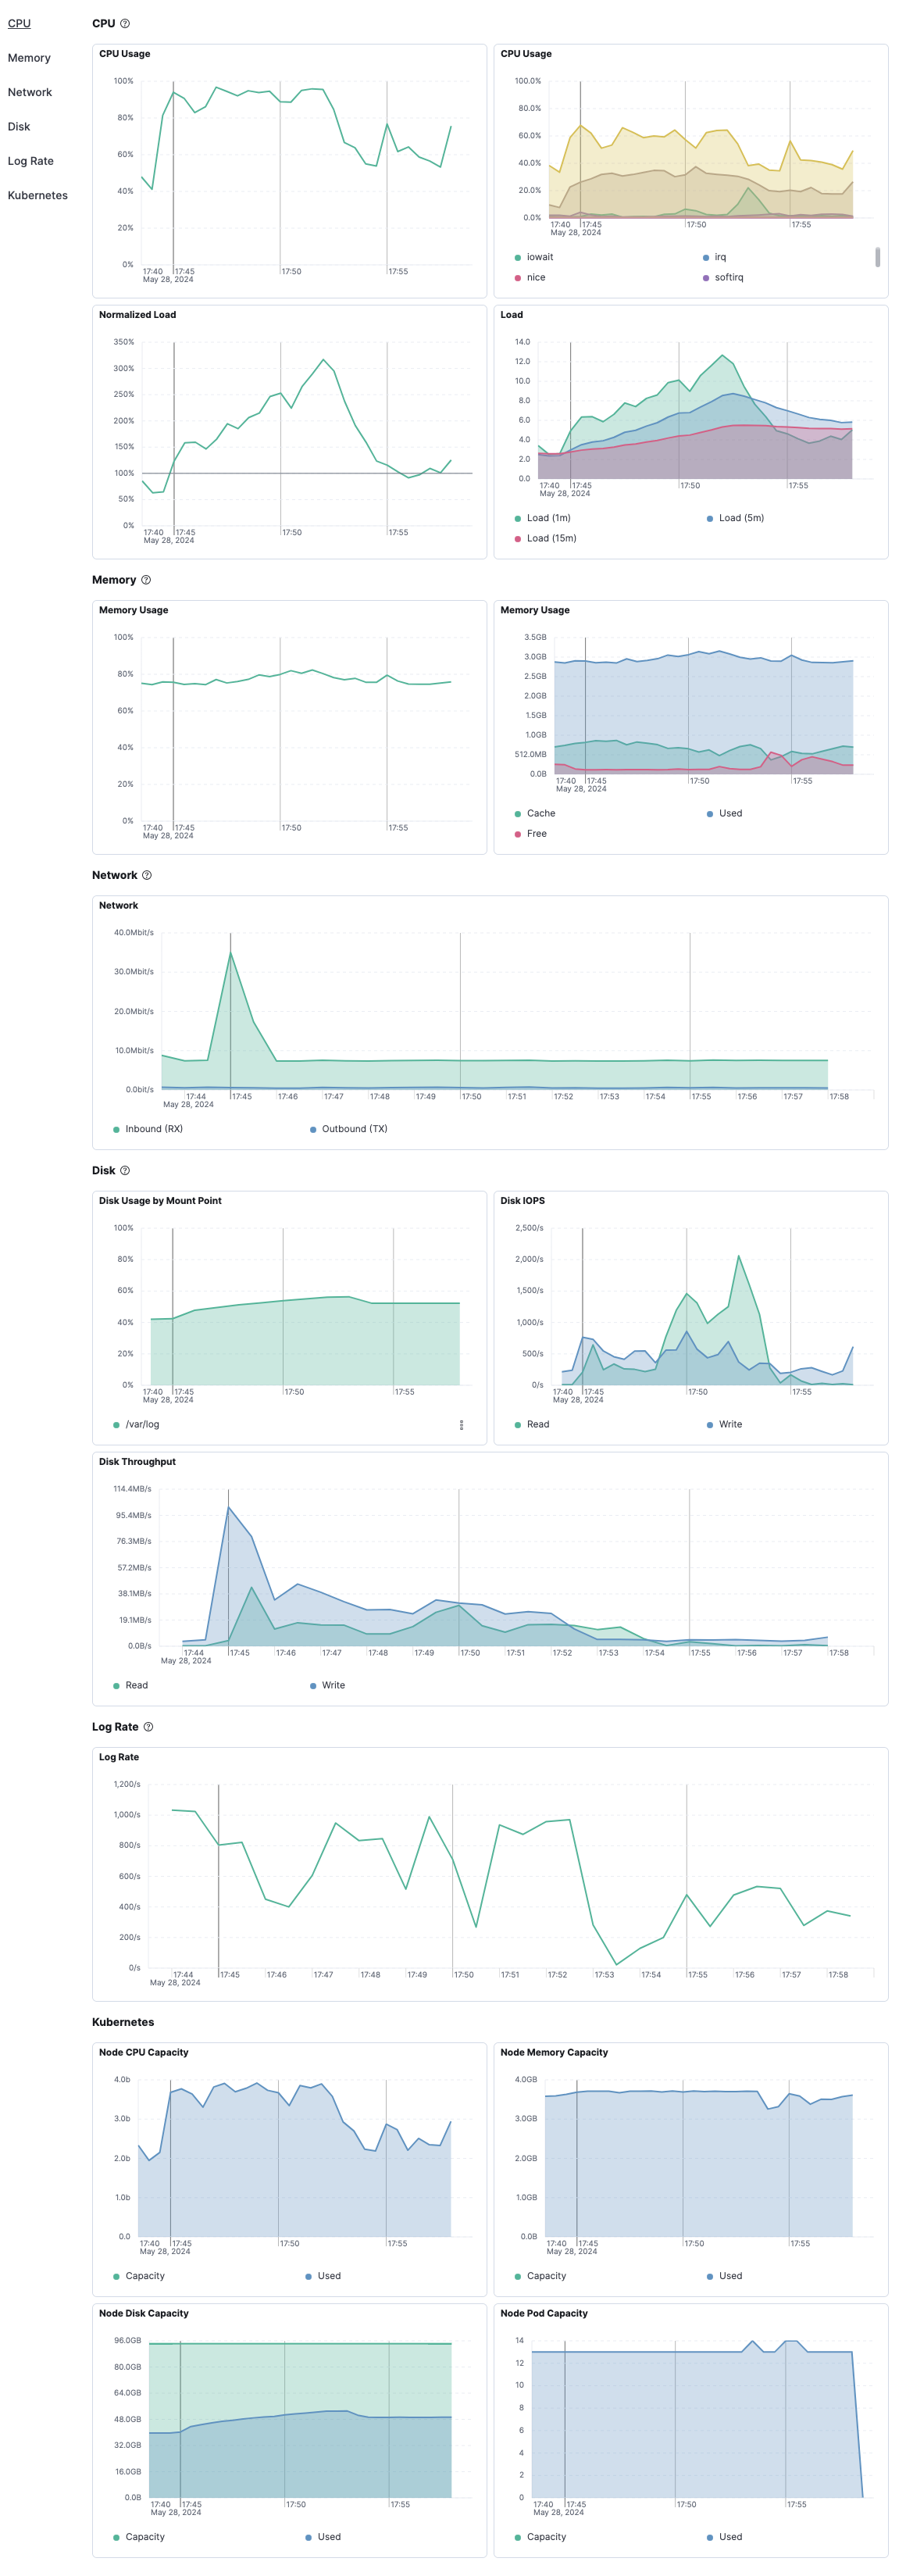
On the Metrics tab, view metrics trending over time, including CPU usage, normalized load, memory usage, disk usage, and other metrics related to disk IOPs and throughput. Place your cursor over a line to view metrics at a specific point in time. From within each visualization, you can choose to open the visualization in Lens.
To see metrics for a specific host, refer to View host details.
Metrics visualizations are powered by Lens, meaning you can continue your analysis in Lens if you require more flexibility. Hover your cursor over a visualization, then click the ellipsis icon in the upper-right corner to open the visualization in Lens.

In Lens, you can examine all the fields and formulas used to create the visualization, make modifications to the visualization, and save your changes.
For more information about using Lens, refer to the Kibana documentation about Lens.
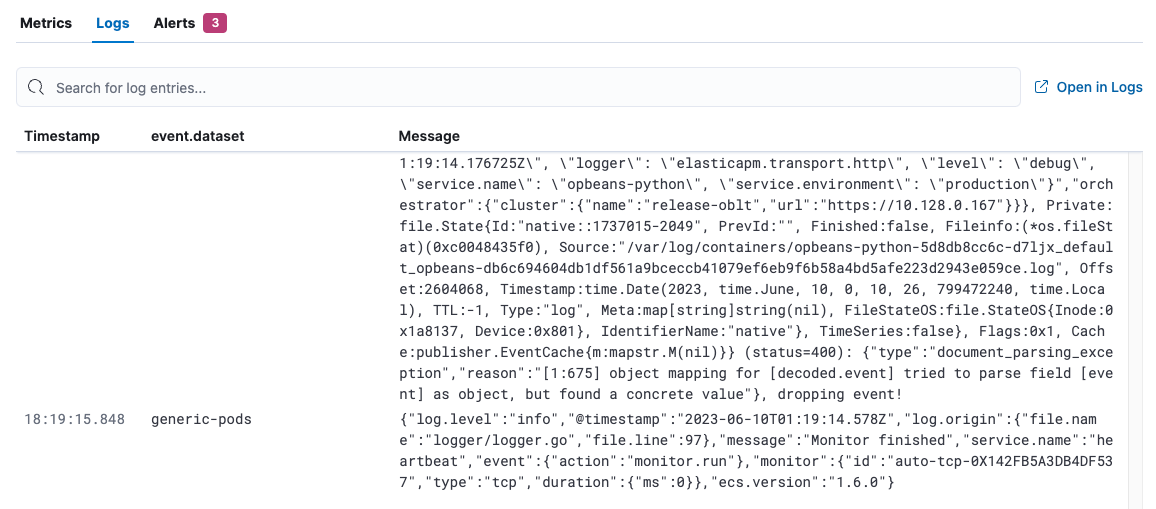
On the Logs tab of the Hosts page, view logs for the systems you are monitoring and search for specific log entries. This view shows logs for all of the hosts returned by the current query.
To see logs for a specific host, refer to View host details.
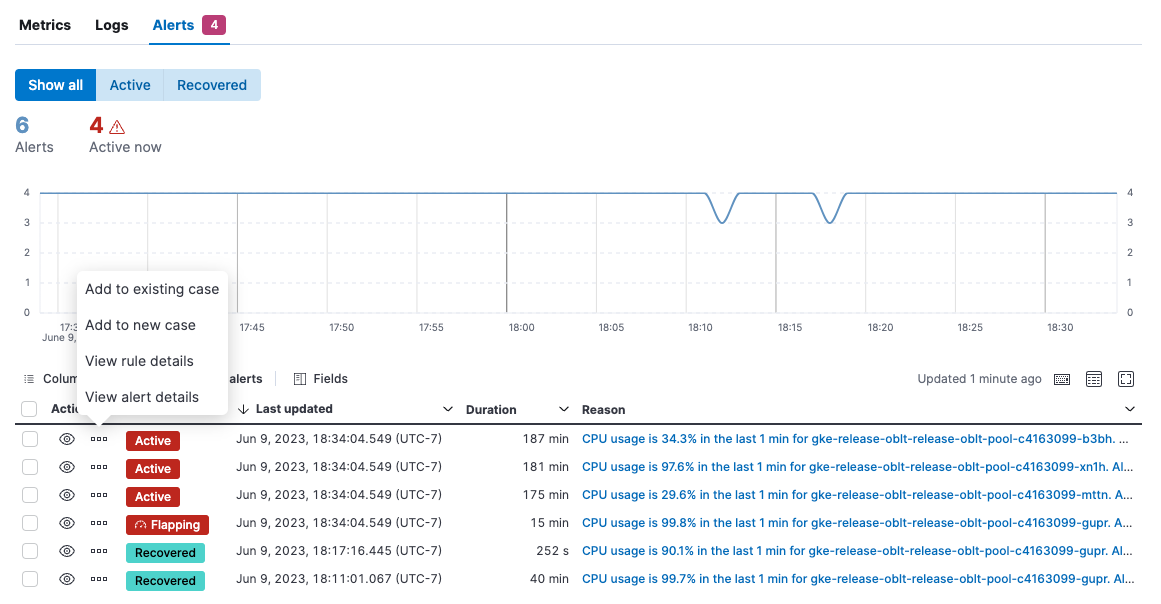
On the Alerts tab of the Hosts page, view active alerts to pinpoint problems. Use this view to figure out which hosts triggered alerts and identify root causes. This view shows alerts for all of the hosts returned by the current query.
From the Actions menu, you can choose to:
- Add the alert to a new or existing case.
- View rule details.
- View alert details.
To see alerts for a specific host, refer to View host details.
Why are alerts missing from the Hosts page?
If your rules are triggering alerts that don’t appear on the Hosts page, edit the rules and make sure they are correctly configured to associate the host name with the alert:
- For Metric threshold or Custom threshold rules, select
host.namein the Group alerts by field. - For Inventory rules, select Host for the node type under Conditions.
To learn more about creating and managing rules, refer to Alerting.
Without leaving the Hosts page, you can view enhanced metrics relating to each host running in your infrastructure. In the list of hosts, find the host you want to monitor, then click the Toggle dialog with details icon ![]() to display the host details overlay.
to display the host details overlay.
To expand the overlay and view more detail, click Open as page in the upper-right corner.
The host details overlay contains the following tabs:
Overview
The Overview tab displays key metrics about the selected host, such as CPU usage, normalized load, memory usage, and max disk usage.
Change the time range to view metrics over a specific period of time.
Expand each section to view more detail related to the selected host, such as metadata, active alerts, services detected on the host, and metrics.
Hover over a specific time period on a chart to compare the various metrics at that given time.
Click Show all to drill down into related data.

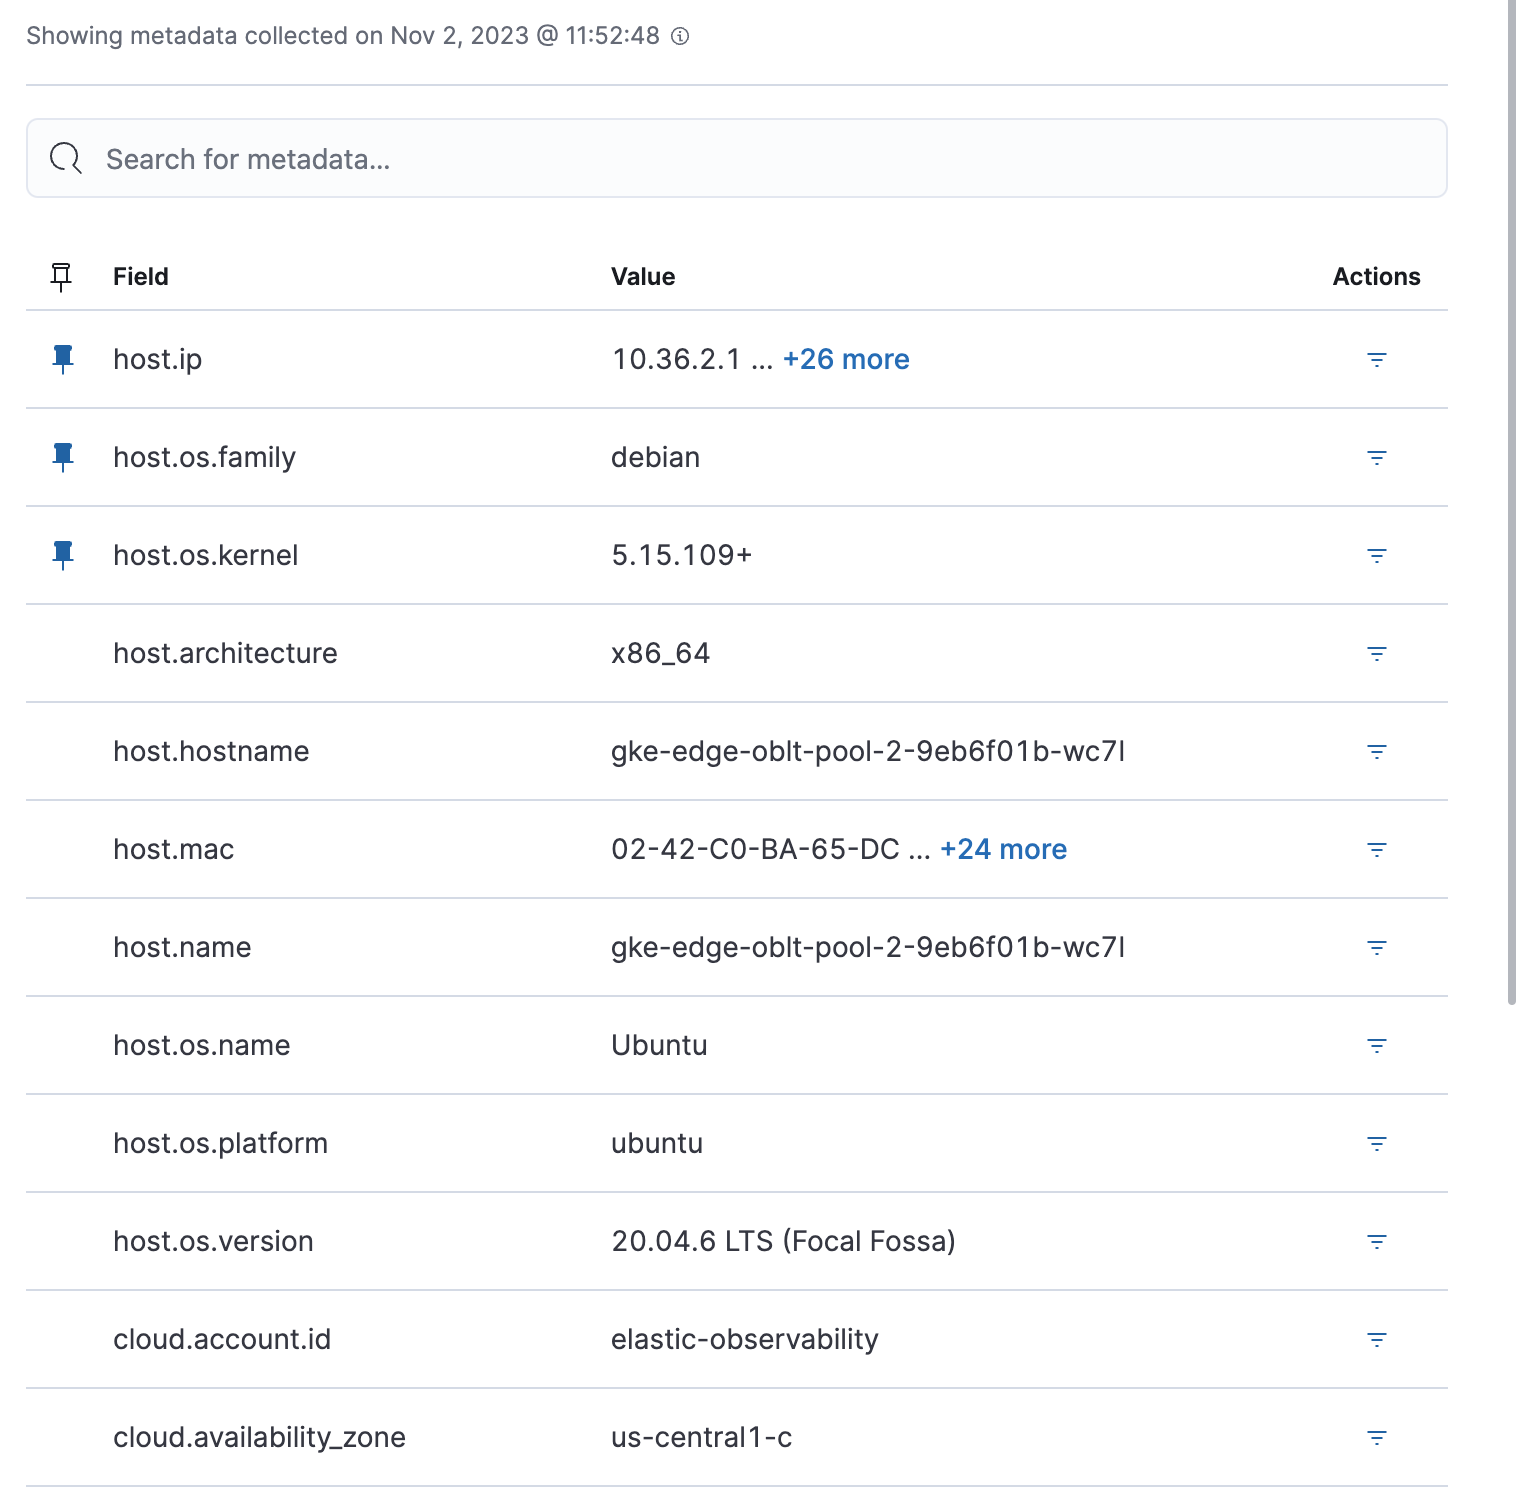
Metadata
The Metadata tab lists all the meta information relating to the host, including host, cloud, and agent information.
This information can help when investigating events—for example, when filtering by operating system or architecture.
Metrics
The Metrics tab shows host metrics organized by type and is more complete than the view available in the Overview tab.
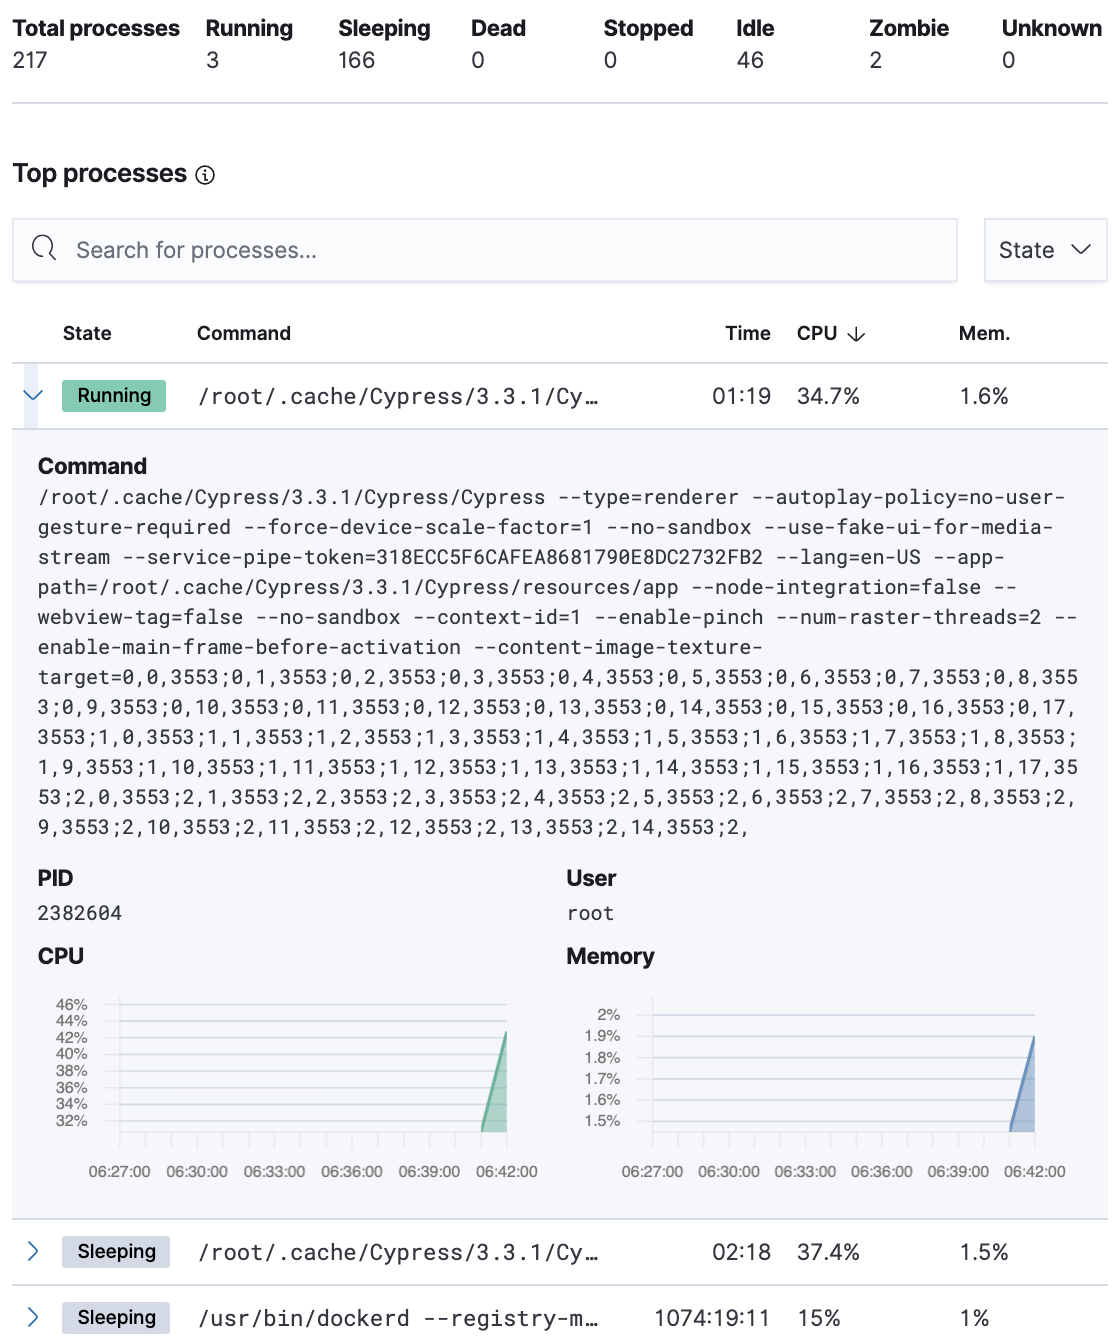
Processes
The Processes tab lists the total number of processes (system.process.summary.total) running on the host, along with the total number of processes in these various states:
- Running (
system.process.summary.running) - Sleeping (
system.process.summary.sleeping) - Stopped (
system.process.summary.stopped) - Idle (
system.process.summary.idle) - Dead (
system.process.summary.dead) - Zombie (
system.process.summary.zombie) - Unknown (
system.process.summary.unknown)
The processes listed in the Top processes table are based on an aggregation of the top CPU and the top memory consuming processes. The number of top processes is controlled by process.include_top_n.by_cpu and process.include_top_n.by_memory.
| Command | Full command line that started the process, including the absolute path to the executable, and all the arguments (system.process.cmdline). |
| PID | Process id (process.pid). |
| User | User name (user.name). |
| CPU | The percentage of CPU time spent by the process since the last event (system.process.cpu.total.pct). |
| Time | The time the process started (system.process.cpu.start_time). |
| Memory | The percentage of memory (system.process.memory.rss.pct) the process occupied in main memory (RAM). |
| State | The current state of the process and the total number of processes (system.process.state). Expected values are: running, sleeping, dead, stopped, idle, zombie, and unknown. |
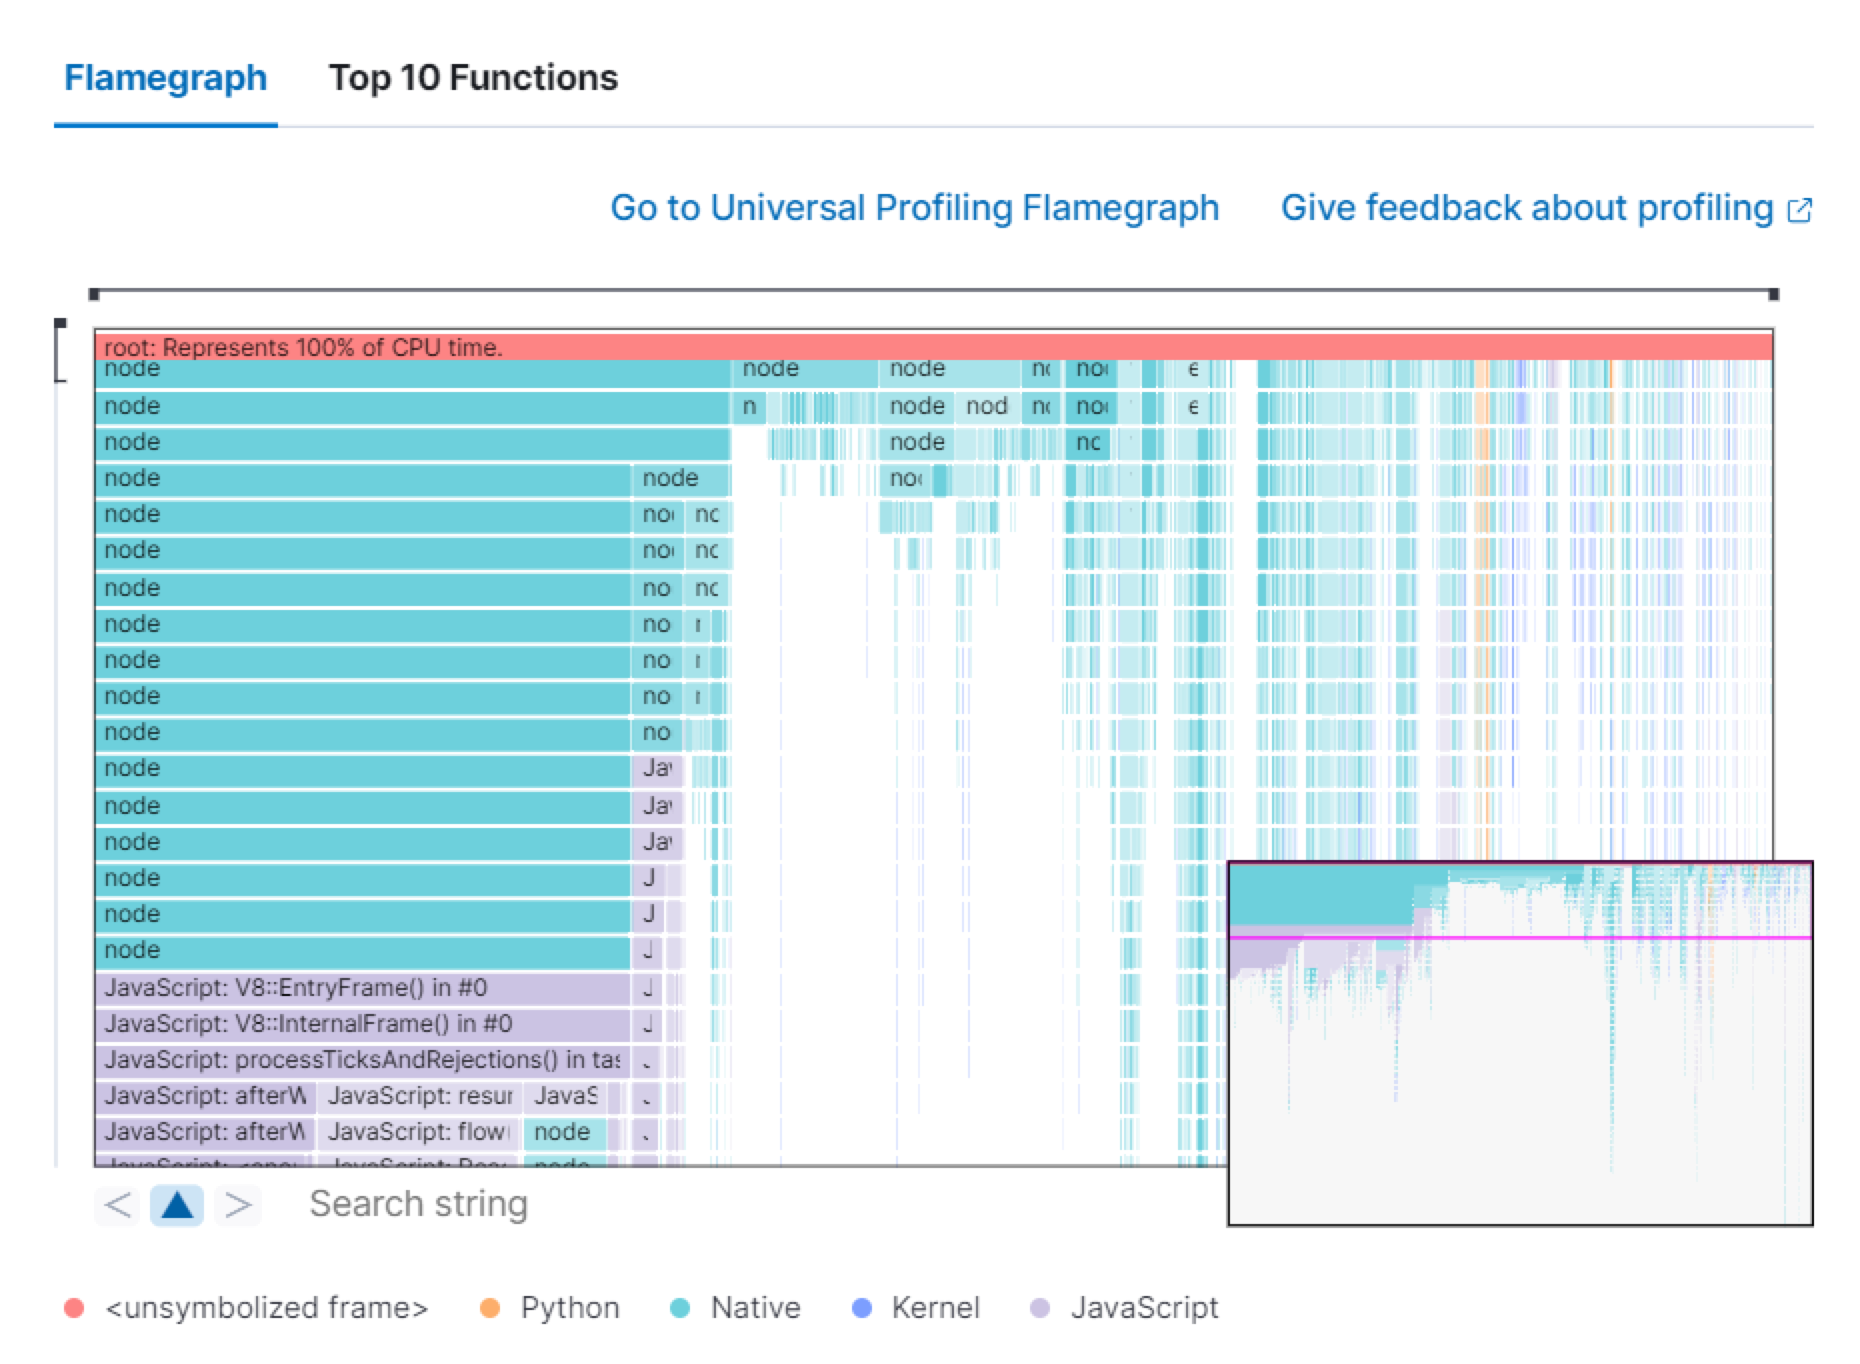
**Universal Profiling**
The Universal Profiling tab shows CPU usage down to the application code level. From here, you can find the sources of resource usage, and identify code that can be optimized to reduce infrastructure costs. The Universal Profiling tab has the following views.
| Flamegraph | A visual representation of the functions that consume the most resources. Each rectangle represents a function. The rectangle width represents the time spent in the function. The number of stacked rectangles represents the stack depth, or the number of functions called to reach the current function. |
| Top 10 Functions | A list of the most expensive lines of code on your host. See the most frequently sampled functions, broken down by CPU time, annualized CO2, and annualized cost estimates. |
For more on Universal Profiling, refer to the Universal Profiling docs.
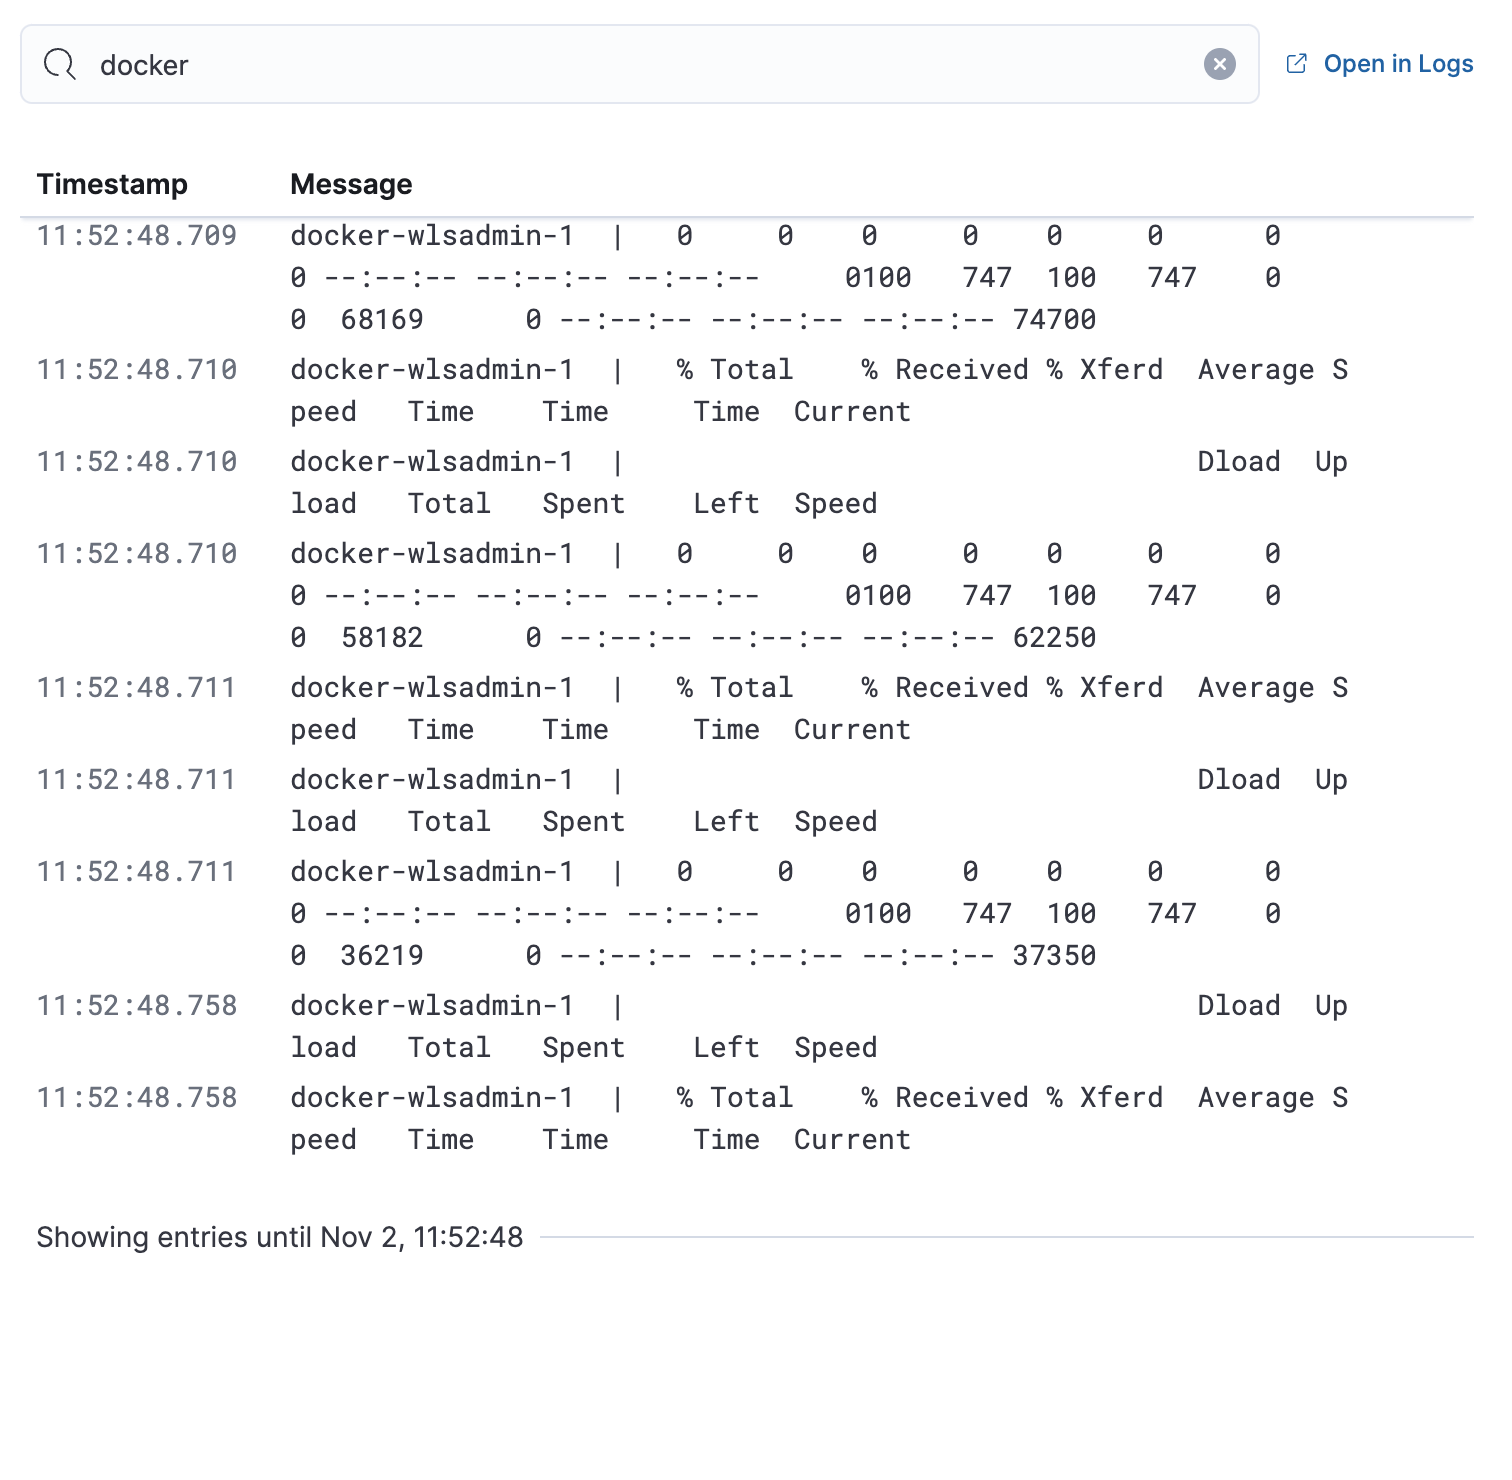
Logs
The Logs tab displays logs relating to the host that you have selected. By default, the logs tab displays the following columns.
| Timestamp | The timestamp of the log entry from the timestamp field. |
| Message | The message extracted from the document. The content of this field depends on the type of log message. If no special log message type is detected, the Elastic Common Schema (ECS) base field, message, is used. |
To view the logs in the Logs app for a detailed analysis, click Open in Logs.
Anomalies
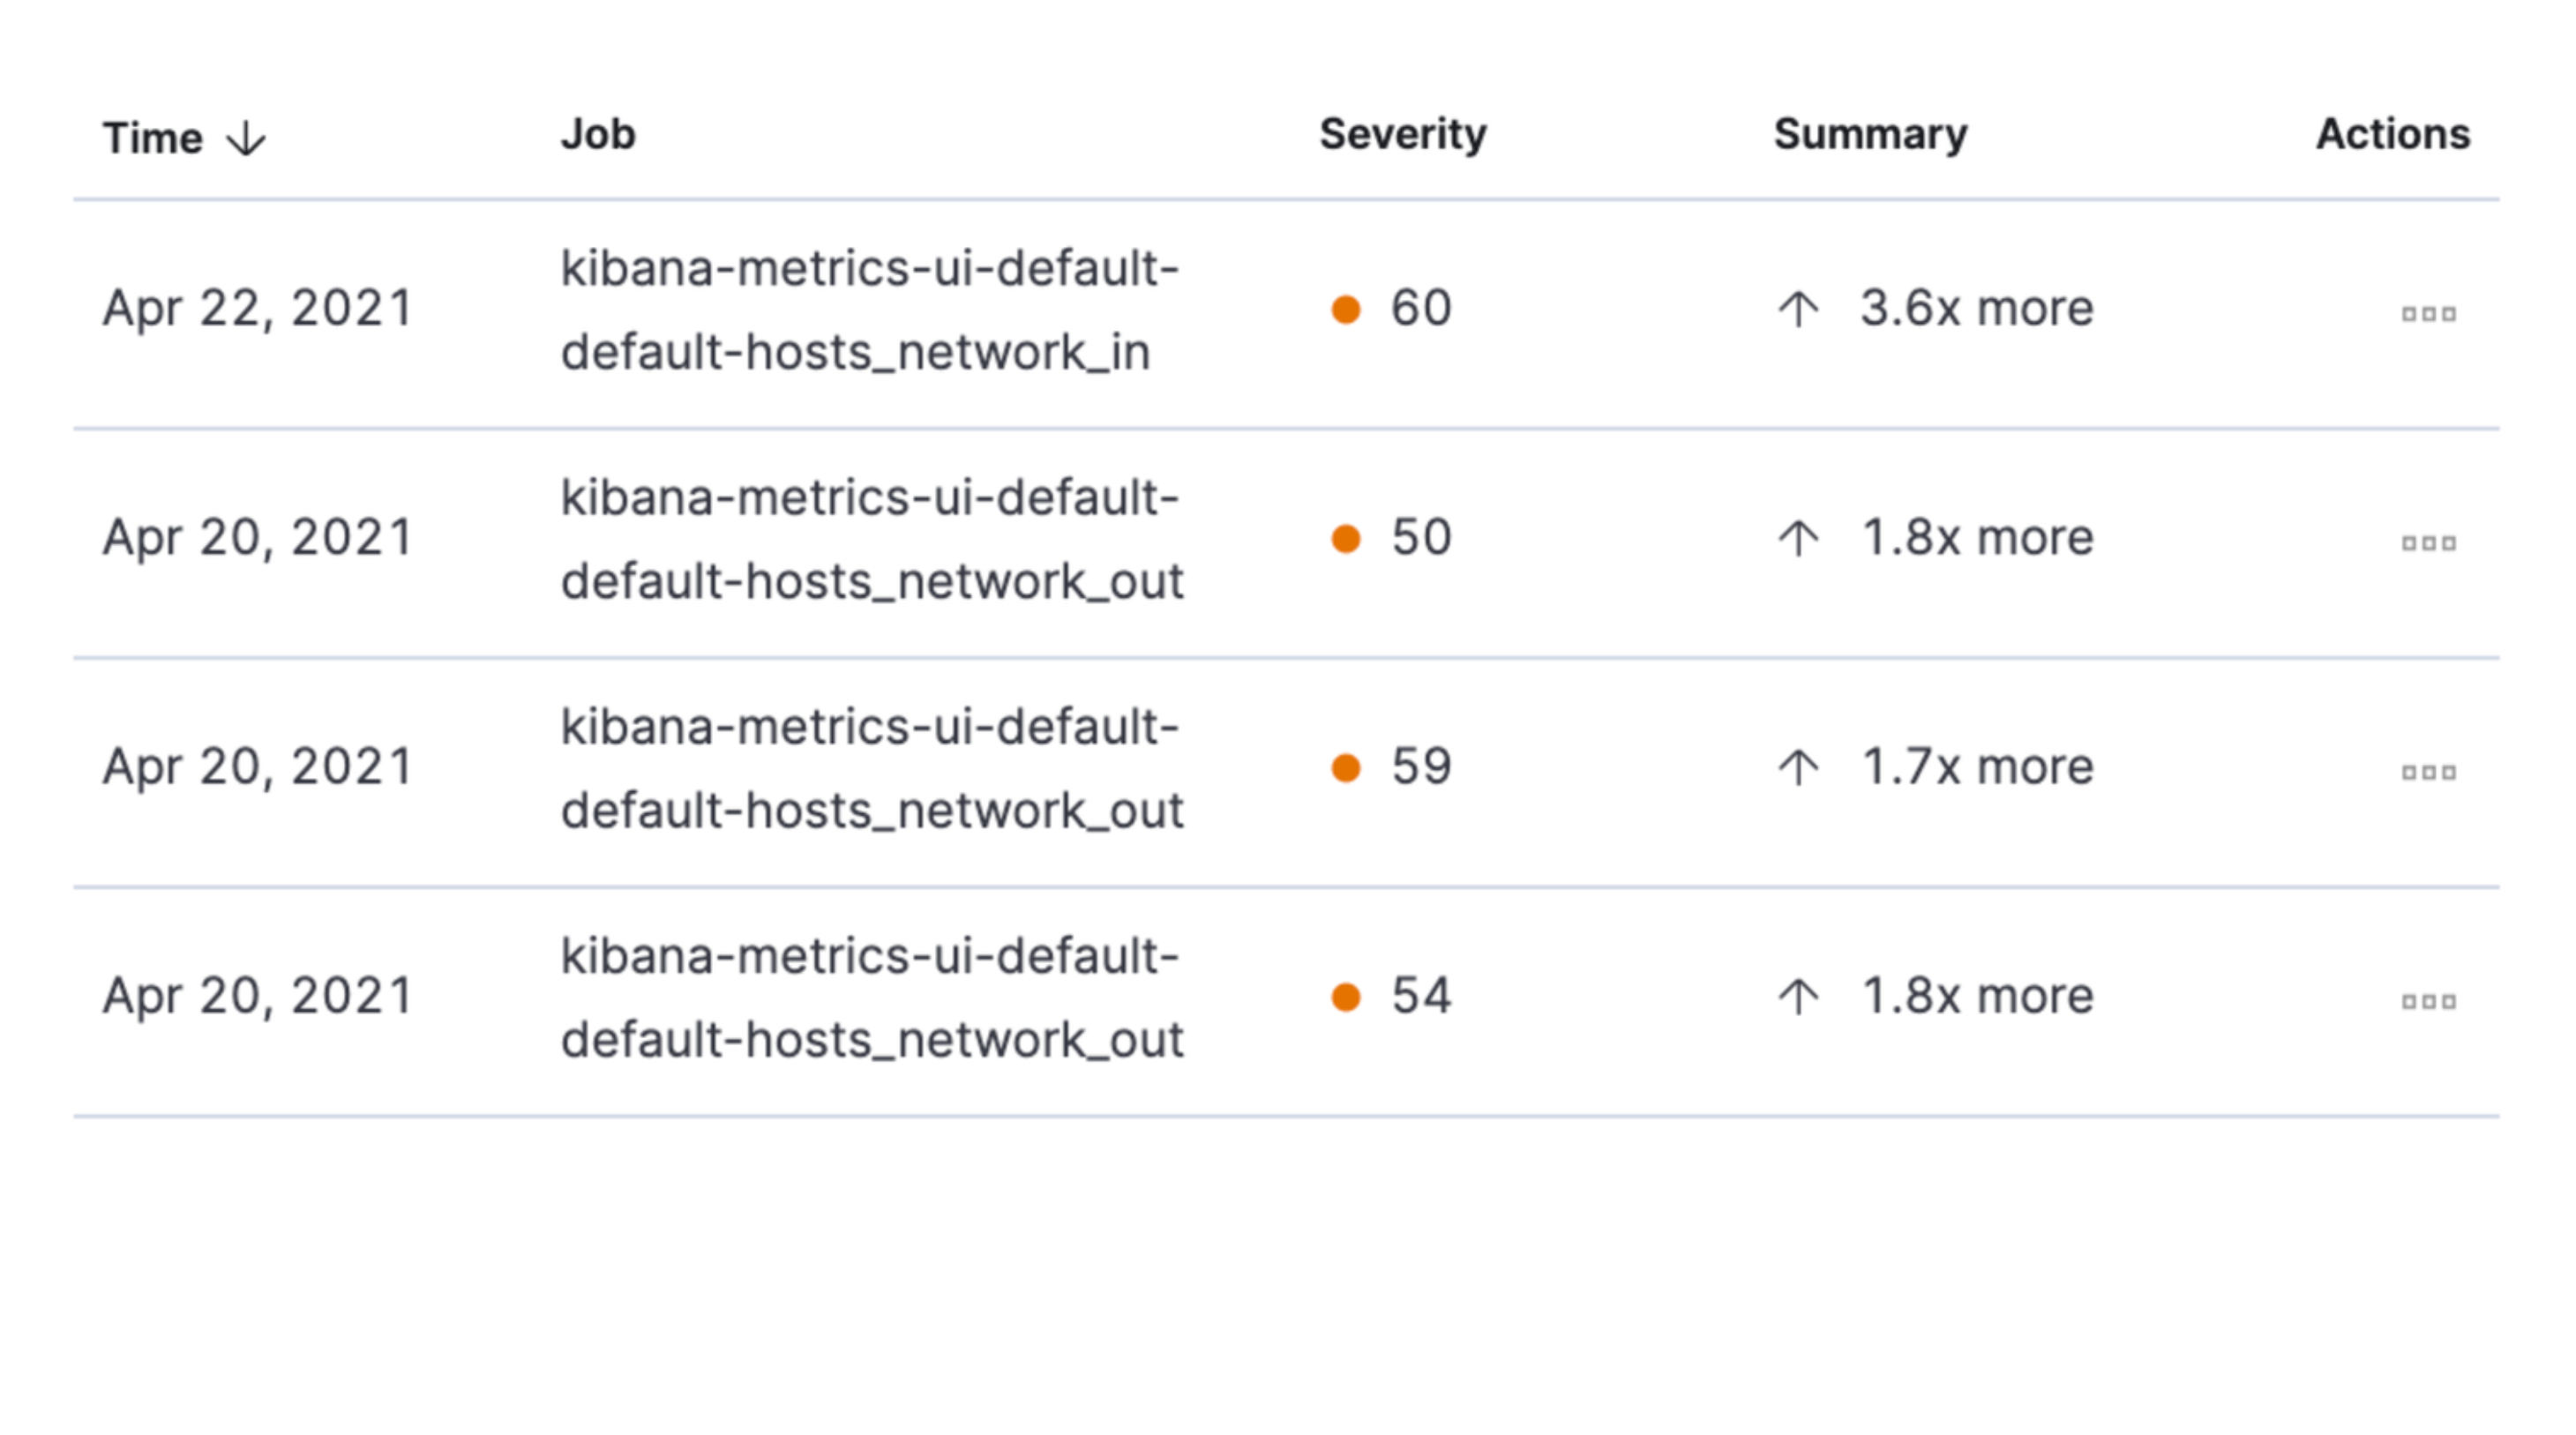
The Anomalies tab displays a list of each single metric anomaly detection job for the specific host. By default, anomaly jobs are sorted by time, showing the most recent jobs first.
Along with the name of each anomaly job, detected anomalies with a severity score equal to 50 or higher are listed. These scores represent a severity of "warning" or higher in the selected time period. The summary value represents the increase between the actual value and the expected ("typical") value of the host metric in the anomaly record result.
To drill down and analyze the metric anomaly, select Actions → Open in Anomaly Explorer. You can also select Actions → Show in Inventory to view the host Inventory page, filtered by the specific metric.
Osquery
For Observability serverless projects, one of the following roles is required to use Osquery.
- Admin: Has full access to project configuration, including the ability to install, manage, and run Osquery queries through Elastic Agent. This role supports both ad hoc (live) queries and scheduled queries against monitored hosts. Admins can view and analyze the results directly in Elasticsearch.
- Editor: Has limited access. Editors can run pre-configured queries, but may have restricted permissions for setting up and scheduling new queries, especially queries that require broader access or permissions adjustments.
- Viewer: Has read-only access to data, including viewing Osquery results if configured by a user with higher permissions. Viewers cannot initiate or schedule Osquery queries themselves.
To learn more about roles, refer to Assign user roles and privileges.
You must have an active Elastic Agent with an assigned agent policy that includes the Osquery Manager integration.
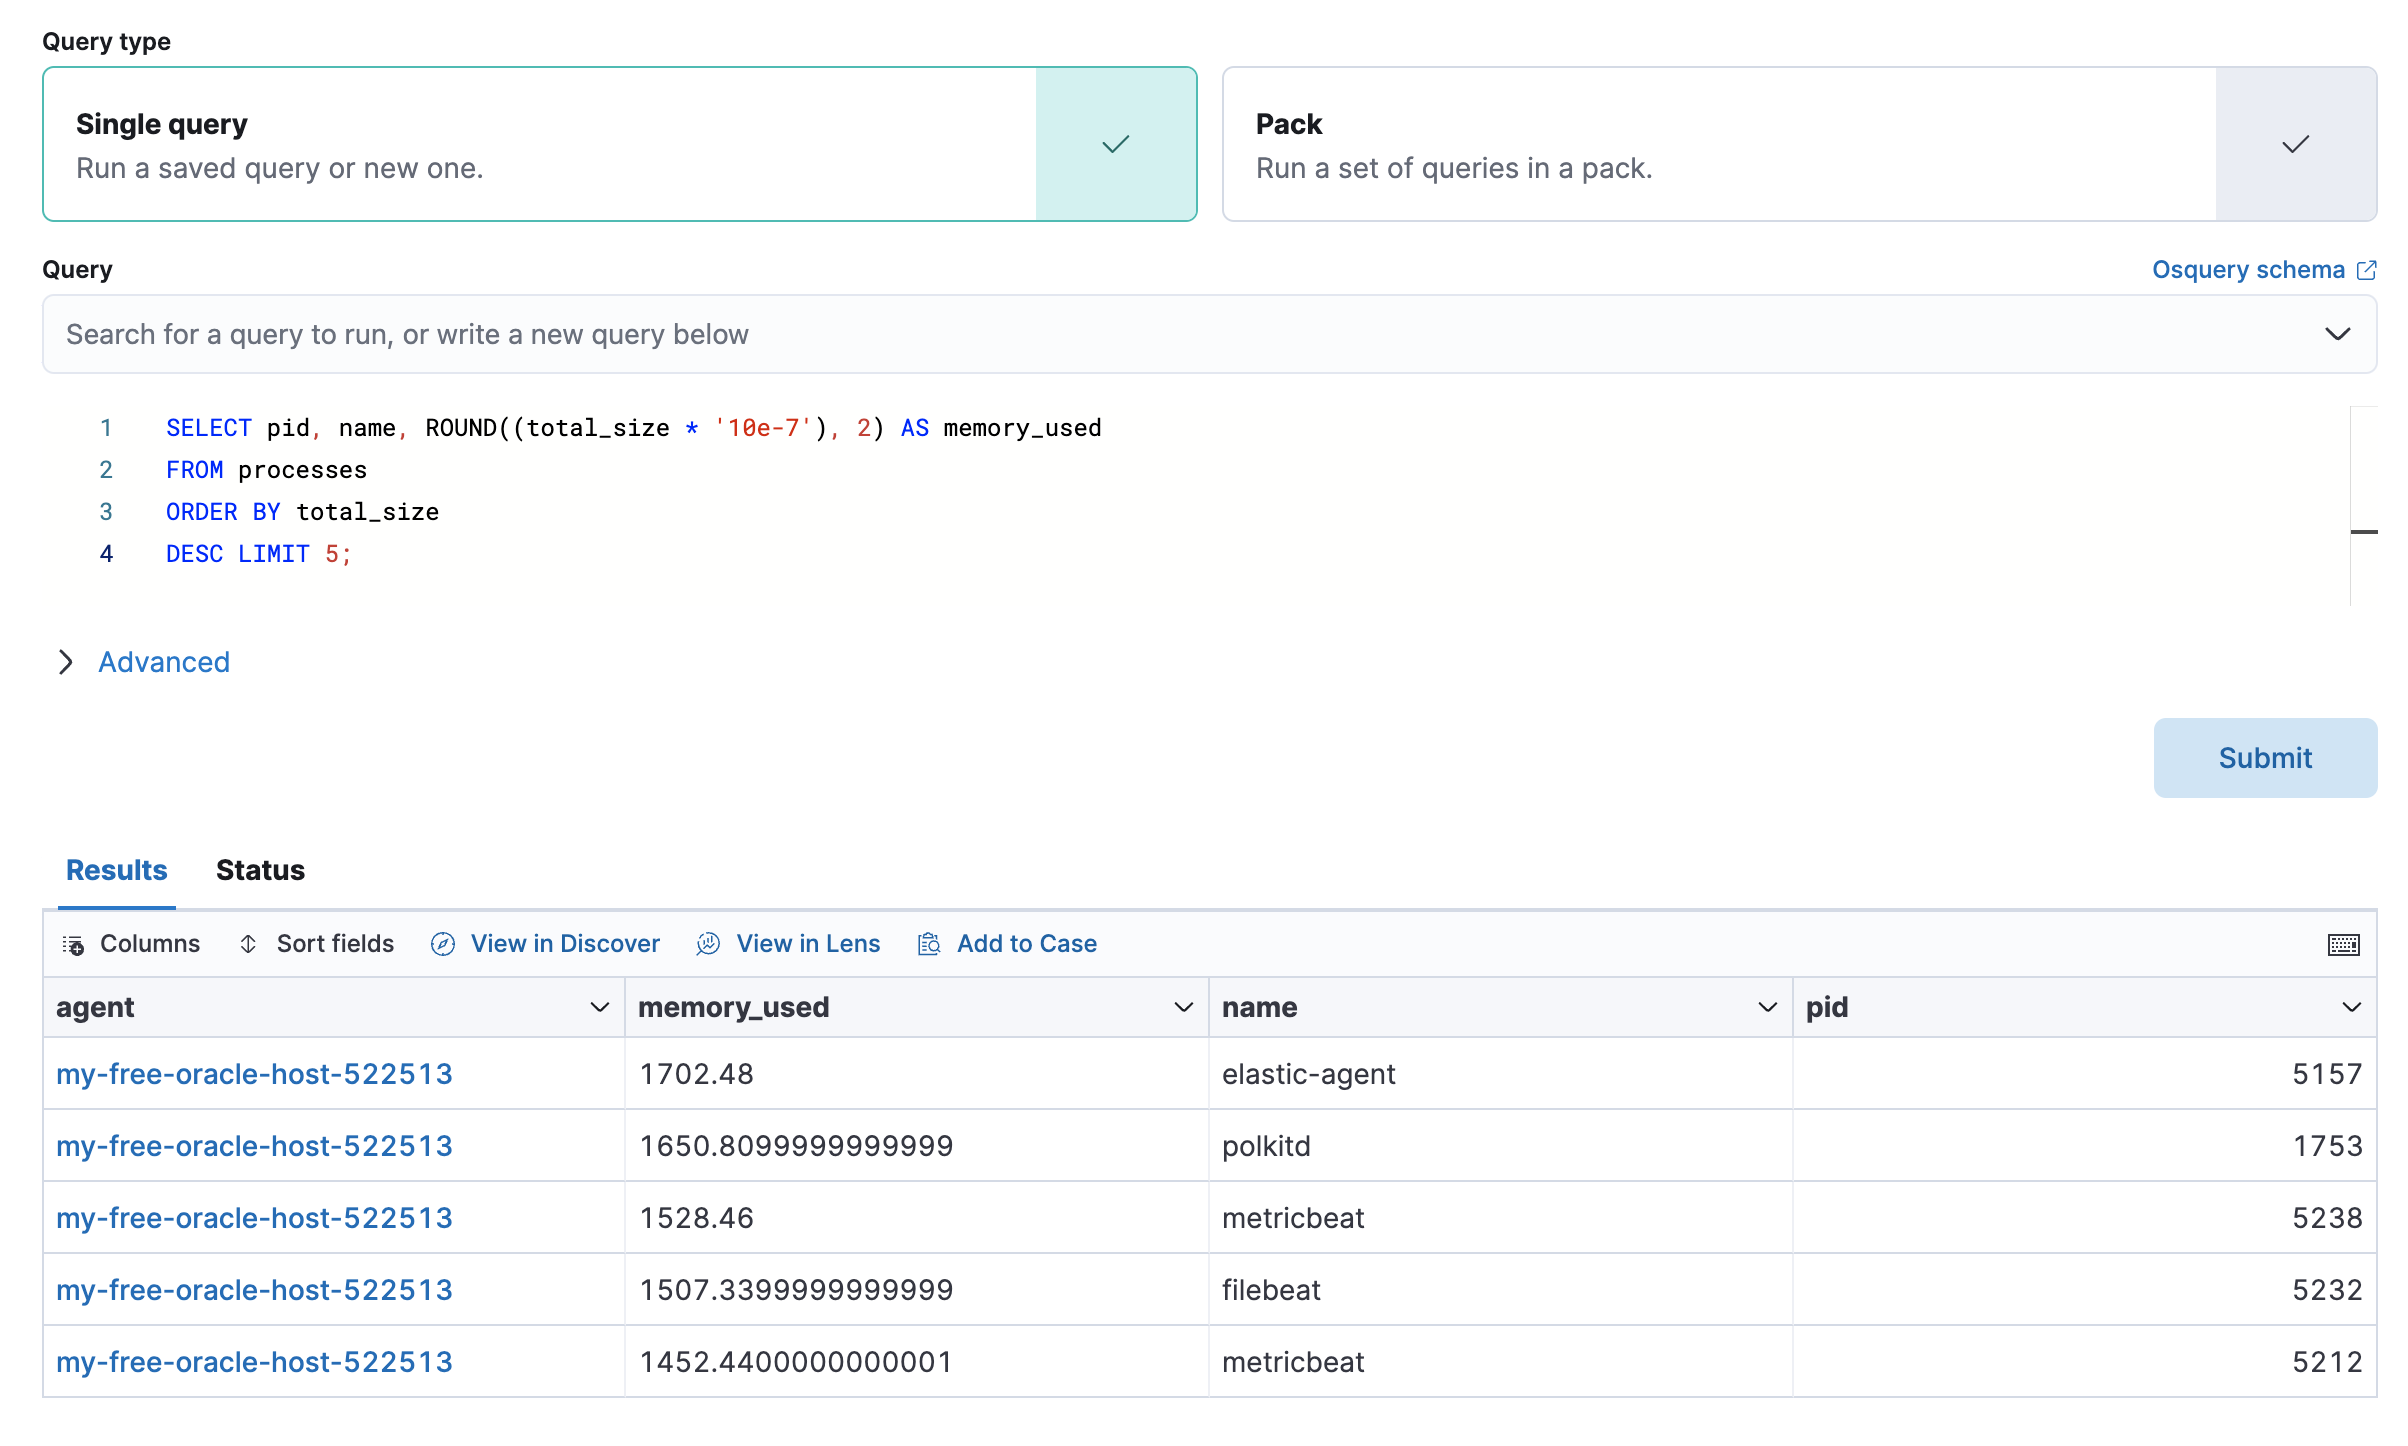
The Osquery tab allows you to build SQL statements to query your host data. You can create and run live or saved queries against the Elastic Agent. Osquery results are stored in Elasticsearch so that you can use the Elastic Stack to search, analyze, and visualize your host metrics. To create saved queries and add scheduled query groups, refer to Osquery.
To view more information about the query, click the Status tab. A query status can result in success, error (along with an error message), or pending (if the Elastic Agent is offline).
Other options include:
- View in Discover to search, filter, and view information about the structure of host metric fields. To learn more, refer to Discover.
- View in Lens to create visualizations based on your host metric fields. To learn more, refer to Lens.
- View the results in full screen mode.
- Add, remove, reorder, and resize columns.
- Sort field names in ascending or descending order.
The metrics shown on the Hosts page are also available when viewing hosts on the Infrastructure inventory page.
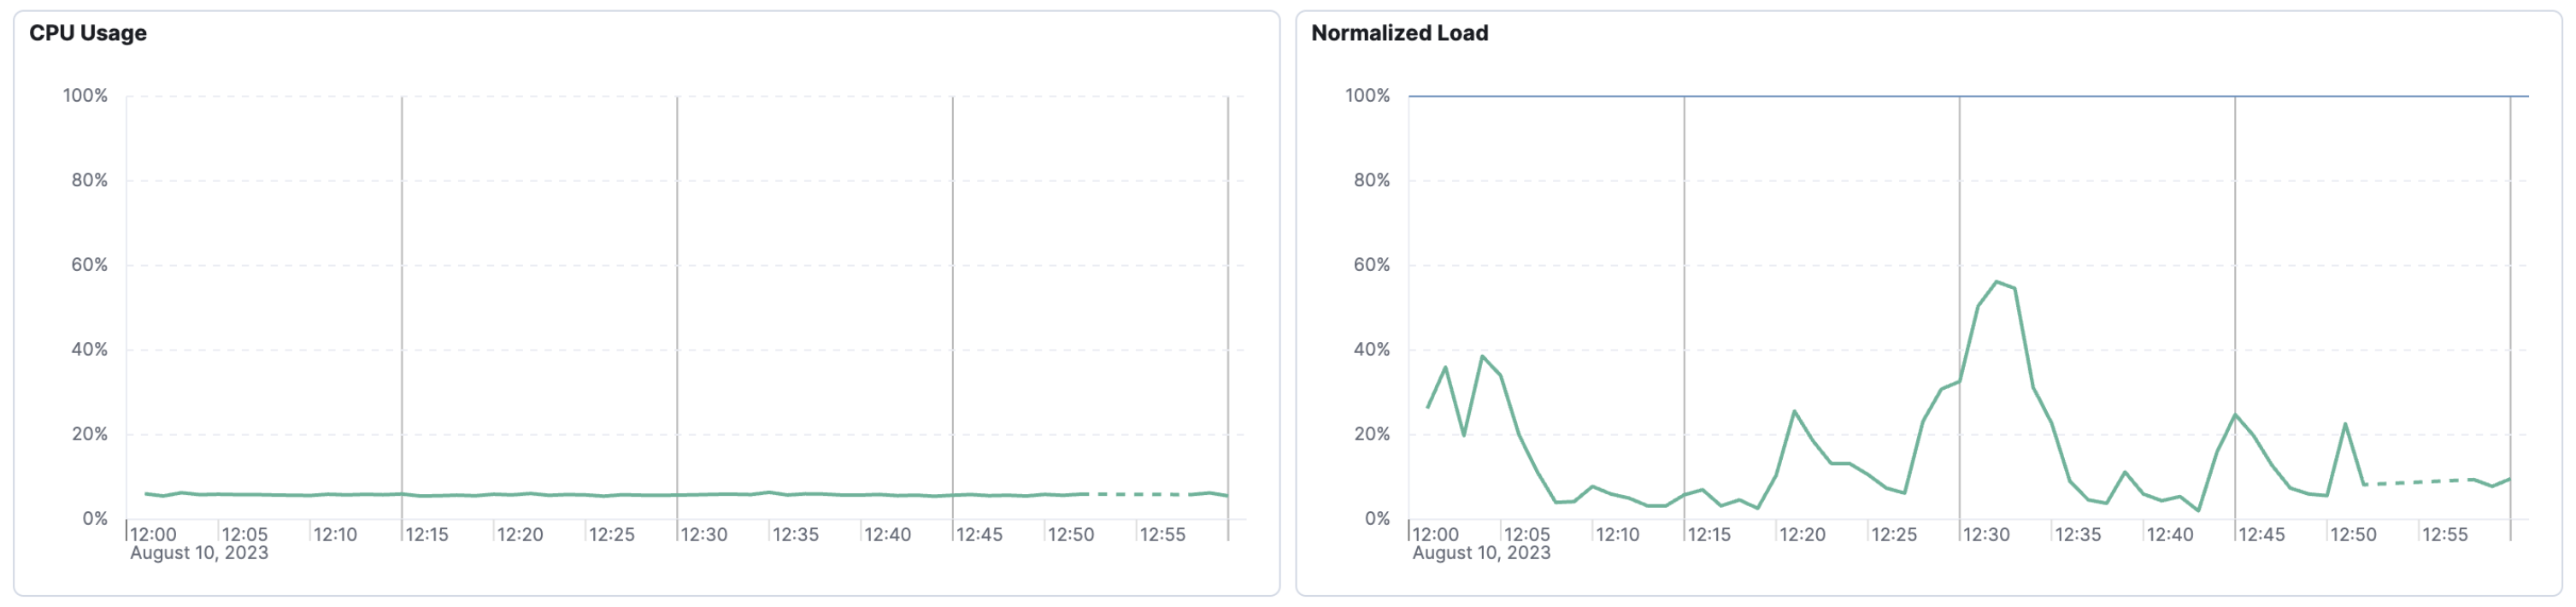
There are a few reasons why you may see dashed lines in your charts.
In this example, the data emission rate is lower than the Lens chart interval. A dashed line connects the known data points to make it easier to visualize trends in the data.
The chart interval is automatically set depending on the selected time duration. To fix this problem, change the selected time range at the top of the page.
Want to dig in further while maintaining the selected time duration? Hover over the chart you’re interested in and select Options → Open in Lens. Once in Lens, you can adjust the chart interval temporarily. Note that this change is not persisted in the Hosts view.
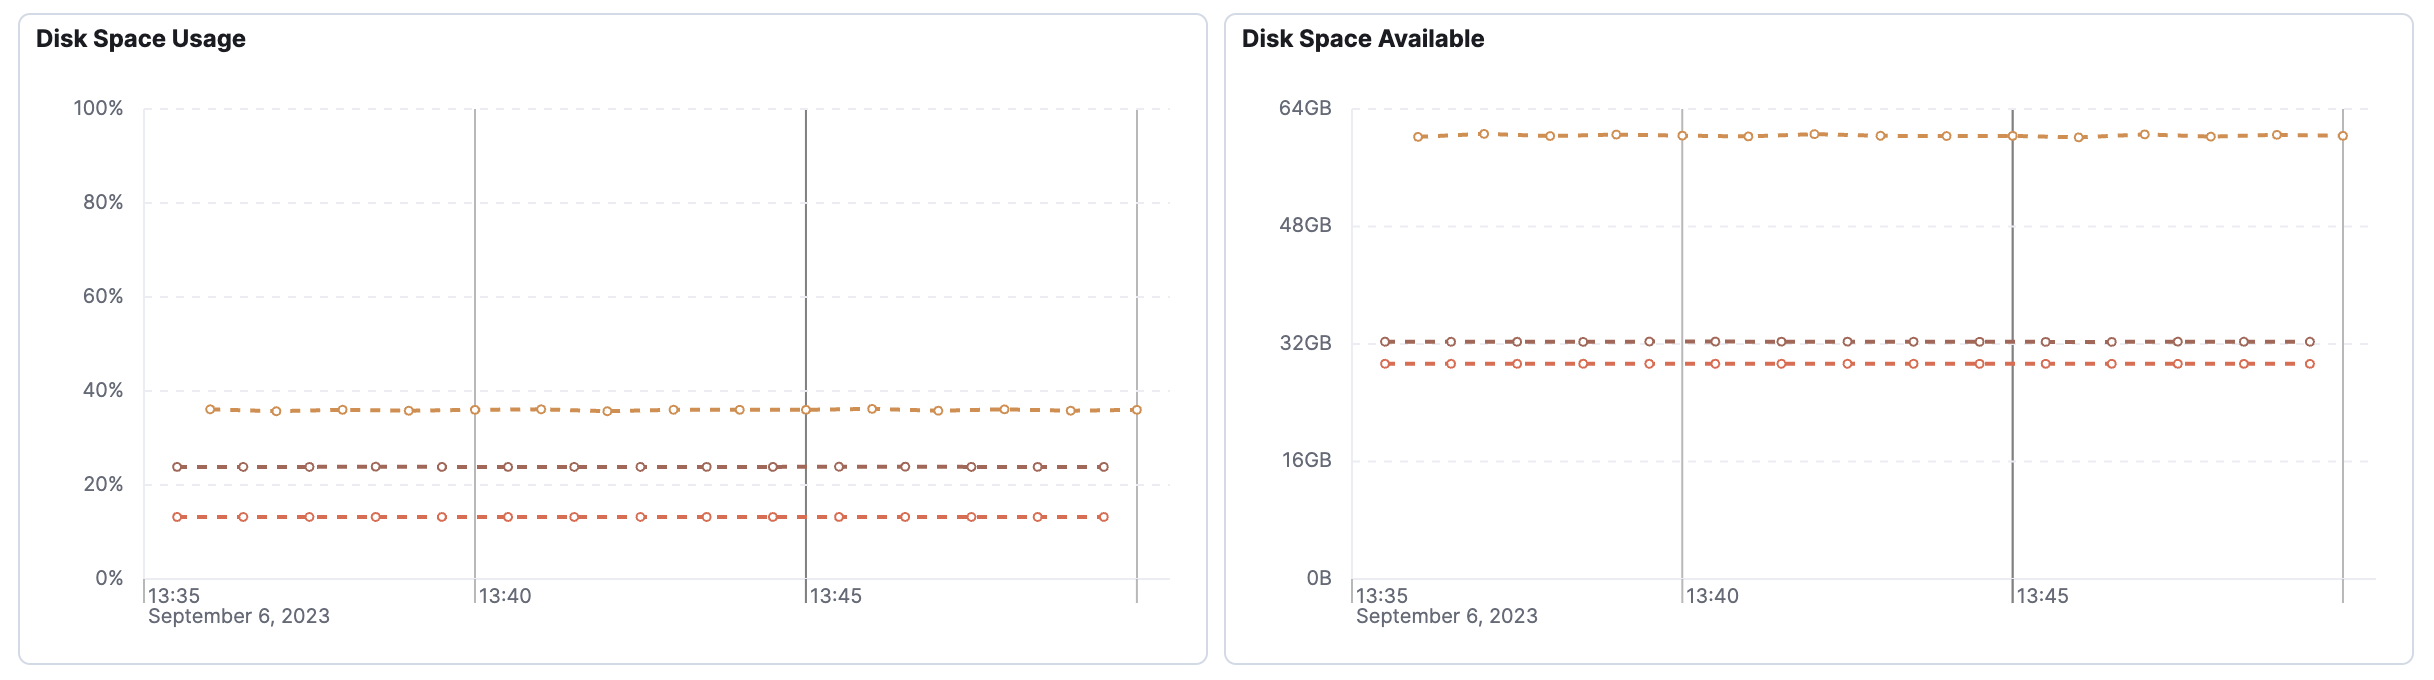
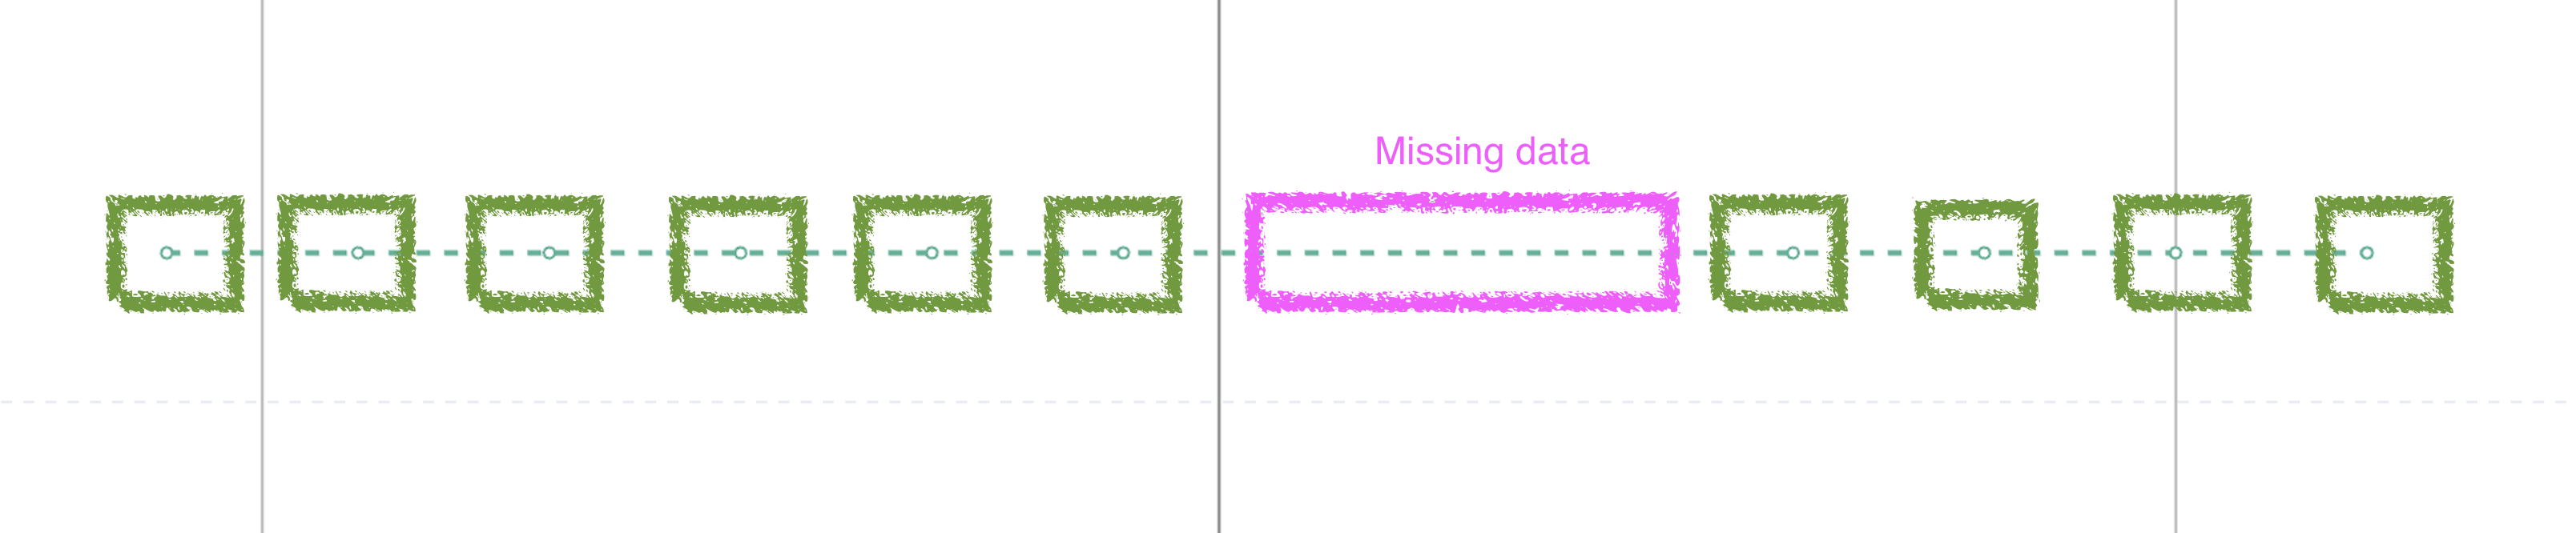
A solid line indicates that the chart interval is set appropriately for the data transmission rate. In this example, a solid line turns into a dashed line—indicating missing data. You may want to investigate this time period to determine if there is an outage or issue.
In the example shown in the screenshot, the data emission rate is lower than the Lens chart interval and there is missing data.
This missing data can be hard to spot at first glance. The green boxes outline regular data emissions, while the missing data is outlined in pink. Similar to the above scenario, you may want to investigate the time period with the missing data to determine if there is an outage or issue.
In the Hosts view, you might see a question mark icon ( ) before a host name with a tooltip note stating that the host has been detected by APM.
When a host is detected by APM, but is not collecting full metrics (for example, through the system integration), it will be listed as a host with the partial metrics collected by APM.
This could mean that the APM agent has not been configured to use the correct host name. Instead, the host name might be the container name or the Kubernetes pod name.
To get the correct host name, you need to set some additional configuration options, specifically system.kubernetes.node.name as described in Kubernetes data.