Create a custom threshold rule
For Observability serverless projects, the Editor role or higher is required to create a custom threshold rule. To learn more, refer to Assign user roles and privileges.
Create a custom threshold rule to trigger an alert when an Elastic Observability Serverless data type reaches or exceeds a given value.
- To access this page, select Alerts from the main navigation.
- Click Manage Rules → Create rule.
- Under Select rule type, select Custom threshold.
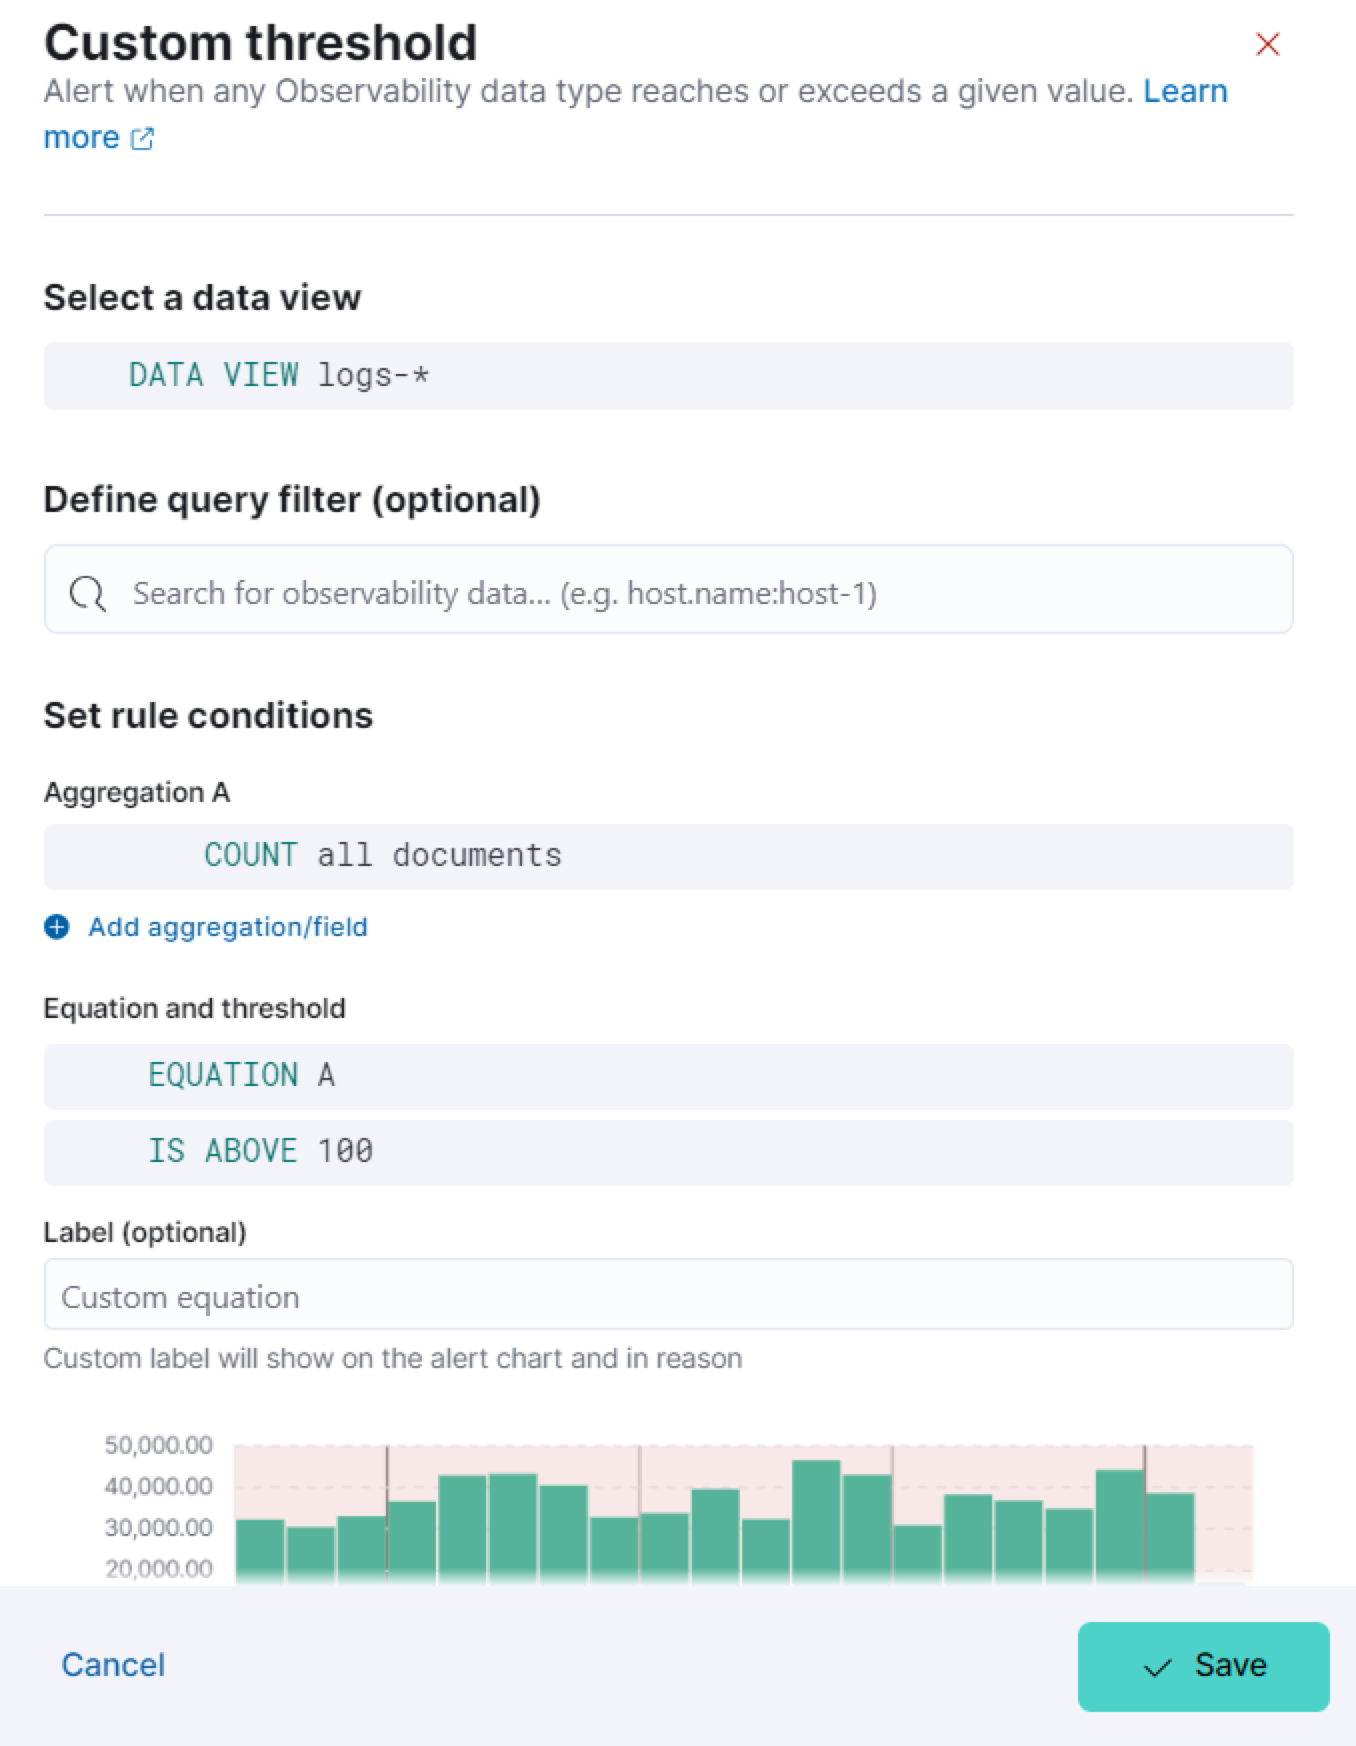
Specify the following settings to define the data the rule applies to:
- Select a data view: Click the data view field to search for and select a data view that points to the indices or data streams that you’re creating a rule for. You can also create a new data view by clicking Create a data view. Refer to Create a data view for more on creating data views.
- Define query filter (optional): Use a query filter to narrow down the data that the rule applies to. For example, set a query filter to a specific host name using the query filter
host.name:host-1to only apply the rule to that host.
Set the conditions for the rule to detect using aggregations, an equation, and a threshold.
Aggregations summarize your data to make it easier to analyze. Set any of the following aggregation types to gather data to create your rule: Average, Max, Min, Cardinality, Count, Sum, Percentile, or Rate. For more information about these options, refer to Aggregation options.
For example, to gather the total number of log documents with a log level of warn:
- Set the Aggregation to Count, and set the KQL Filter to
log.level: "warn". - Set the threshold to
IS ABOVE 100to trigger an alert when the number of log documents with a log level ofwarnreaches 100.
Set an equation using your aggregations. Based on the results of your equation, set a threshold to define when to trigger an alert. The equations use basic math or boolean logic. Refer to the following examples for possible use cases.
Add, subtract, multiply, or divide your aggregations to define conditions for alerting.
Example: Set an equation and threshold to trigger an alert when a metric is above a threshold. For this example, we’ll use average CPU usage—the percentage of CPU time spent in states other than idle or IOWait normalized by the number of CPU cores—and trigger an alert when CPU usage is above a specific percentage. To do this, set the following aggregations, equation, and threshold:
Set the following aggregations:
- Aggregation A: Average
system.cpu.user.pct - Aggregation B: Average
system.cpu.system.pct - Aggregation C: Max
system.cpu.cores.
- Aggregation A: Average
Set the equation to
(A + B) / C * 100Set the threshold to
IS ABOVE 95to alert when CPU usage is above 95%.
Use conditional operators and comparison operators with you aggregations to define conditions for alerting.
Example: Set an equation and threshold to trigger an alert when the number of stateful pods differs from the number of desired pods. For this example, we’ll use kubernetes.statefulset.ready and kubernetes.statefulset.desired, and trigger an alert when their values differ. To do this, set the following aggregations, equation, and threshold:
Set the following aggregations:
- Aggregation A: Sum
kubernetes.statefulset.ready - Aggregation B: Sum
kubernetes.statefulset.desired
- Aggregation A: Sum
Set the equation to
A == B ? 1 : 0. If A and B are equal, the result is1. If they’re not equal, the result is0.Set the threshold to
IS BELOW 1to trigger an alert when the result is0and the field values do not match.
The preview chart provides a visualization of how many entries match your configuration. The shaded area shows the threshold you’ve set.
If you use the Group alerts by option, the maximum bar size will be 3. It will only show the top 3 fields.
Set one or more group alerts by fields for custom threshold rules to perform a composite aggregation against the selected fields. When any of these groups match the selected rule conditions, an alert is triggered per group.
When you select multiple groupings, the group name is separated by commas.
For example, if you group alerts by the host.name and host.architecture fields, and there are two hosts (Host A and Host B) and two architectures (Architecture A and Architecture B), the composite aggregation forms multiple groups.
If the Host A, Architecture A group matches the rule conditions, but the Host B, Architecture B group doesn’t, one alert is triggered for Host A, Architecture A.
If you select one field—for example, host.name—and Host A matches the conditions but Host B doesn’t, one alert is triggered for Host A. If both groups match the conditions, alerts are triggered for both groups.
Optionally configure the rule to trigger an alert when:
- there is no data, or
- a group that was previously detected stops reporting data.
To do this, select Alert me if there’s no data.
The behavior of the alert depends on whether any group alerts by fields are specified:
No "group alerts by" fields: (Default) A "no data" alert is triggered if the condition fails to report data over the expected time period, or the rule fails to query Elasticsearch. This alert means that something is wrong and there is not enough data to evaluate the related threshold.
Has "group alerts by" fields: If a previously detected group stops reporting data, a "no data" alert is triggered for the missing group.
For example, consider a scenario where
host.nameis the group alerts by field for CPU usage above 80%. The first time the rule runs, two hosts report data:host-1andhost-2. The second time the rule runs,host-1does not report any data, so a "no data" alert is triggered forhost-1. When the rule runs again, ifhost-1starts reporting data again, there are a couple possible scenarios:- If
host-1reports data for CPU usage and it is above the threshold of 80%, no new alert is triggered. Instead the existing alert changes from "no data" to a triggered alert that breaches the threshold. Keep in mind that no notifications are sent in this case because there is still an ongoing issue. - If
host-1reports CPU usage below the threshold of 80%, the alert status is changed to recovered.
- If
How to untrack decommissioned hosts
If a host (for example, host-1) is decommissioned, you probably no longer want to see "no data" alerts about it. To mark an alert as untracked: Go to the Alerts table, click the  icon to expand the "More actions" menu, and click Mark as untracked.
You can extend your rules with actions that interact with third-party systems, write to logs or indices, or send user notifications. You can add an action to a rule at any time. You can create rules without adding actions, and you can also define multiple actions for a single rule.
To add actions to rules, you must first create a connector for that service (for example, an email or external incident management system), which you can then use for different rules, each with their own action frequency.
Connector types
Connectors provide a central place to store connection information for services and integrations with third party systems. The following connectors are available when defining actions for alerting rules:
- Cases
- D3 Security
- IBM Resilient
- Index
- Jira
- Microsoft Teams
- Observability AI Assistant
- Opsgenie
- PagerDuty
- Server log
- ServiceNow ITOM
- ServiceNow ITSM
- ServiceNow SecOps
- Slack
- Swimlane
- Torq
- Webhook
- xMatters
Some connector types are paid commercial features, while others are free. For a comparison of the Elastic subscription levels, go to the subscription page.
For more information on creating connectors, refer to Connectors.
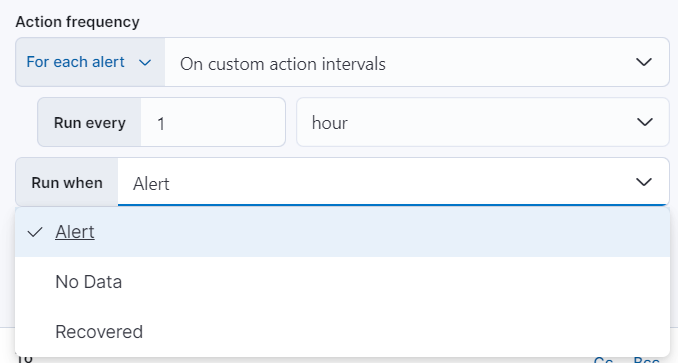
Action frequency
After you select a connector, you must set the action frequency. You can choose to create a summary of alerts on each check interval or on a custom interval. Alternatively, you can set the action frequency such that you choose how often the action runs (for example, at each check interval, only when the alert status changes, or at a custom action interval). In this case, you must also select the specific threshold condition that affects when actions run: Alert, No Data, or Recovered.
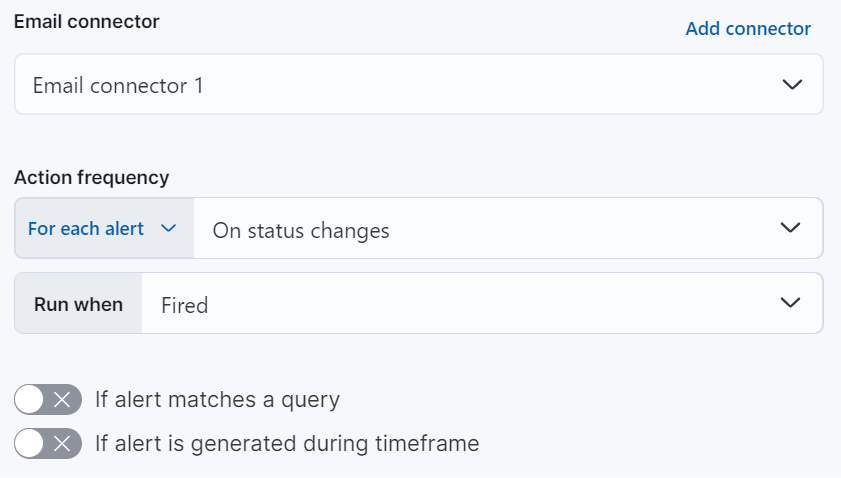
You can also further refine the conditions under which actions run by specifying that actions only run when they match a KQL query or when an alert occurs within a specific time frame:
- If alert matches query: Enter a KQL query that defines field-value pairs or query conditions that must be met for notifications to send. The query only searches alert documents in the indices specified for the rule.
- If alert is generated during timeframe: Set timeframe details. Notifications are only sent if alerts are generated within the timeframe you define.
Action variables
Use the default notification message or customize it. You can add more context to the message by clicking the Add variable icon  and selecting from a list of available variables.
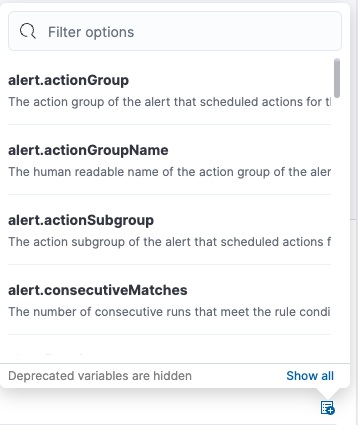
The following variables are specific to this rule type. You can also specify variables common to all rules.
context.alertDetailsUrl- Link to the alert troubleshooting view for further context and details. This will be an empty string if the
server.publicBaseUrlis not configured. context.cloud- The cloud object defined by ECS if available in the source.
context.container- The container object defined by ECS if available in the source.
context.group- The object containing groups that are reporting data.
context.host- The host object defined by ECS if available in the source.
context.labels- List of labels associated with the entity where this alert triggered.
context.orchestrator- The orchestrator object defined by ECS if available in the source.
context.reason- A concise description of the reason for the alert.
context.tags- List of tags associated with the entity where this alert triggered.
context.timestamp- A timestamp of when the alert was detected.
context.value- List of the condition values.
context.viewInAppUrl-
Link to the alert source.