View infrastructure metrics by resource type
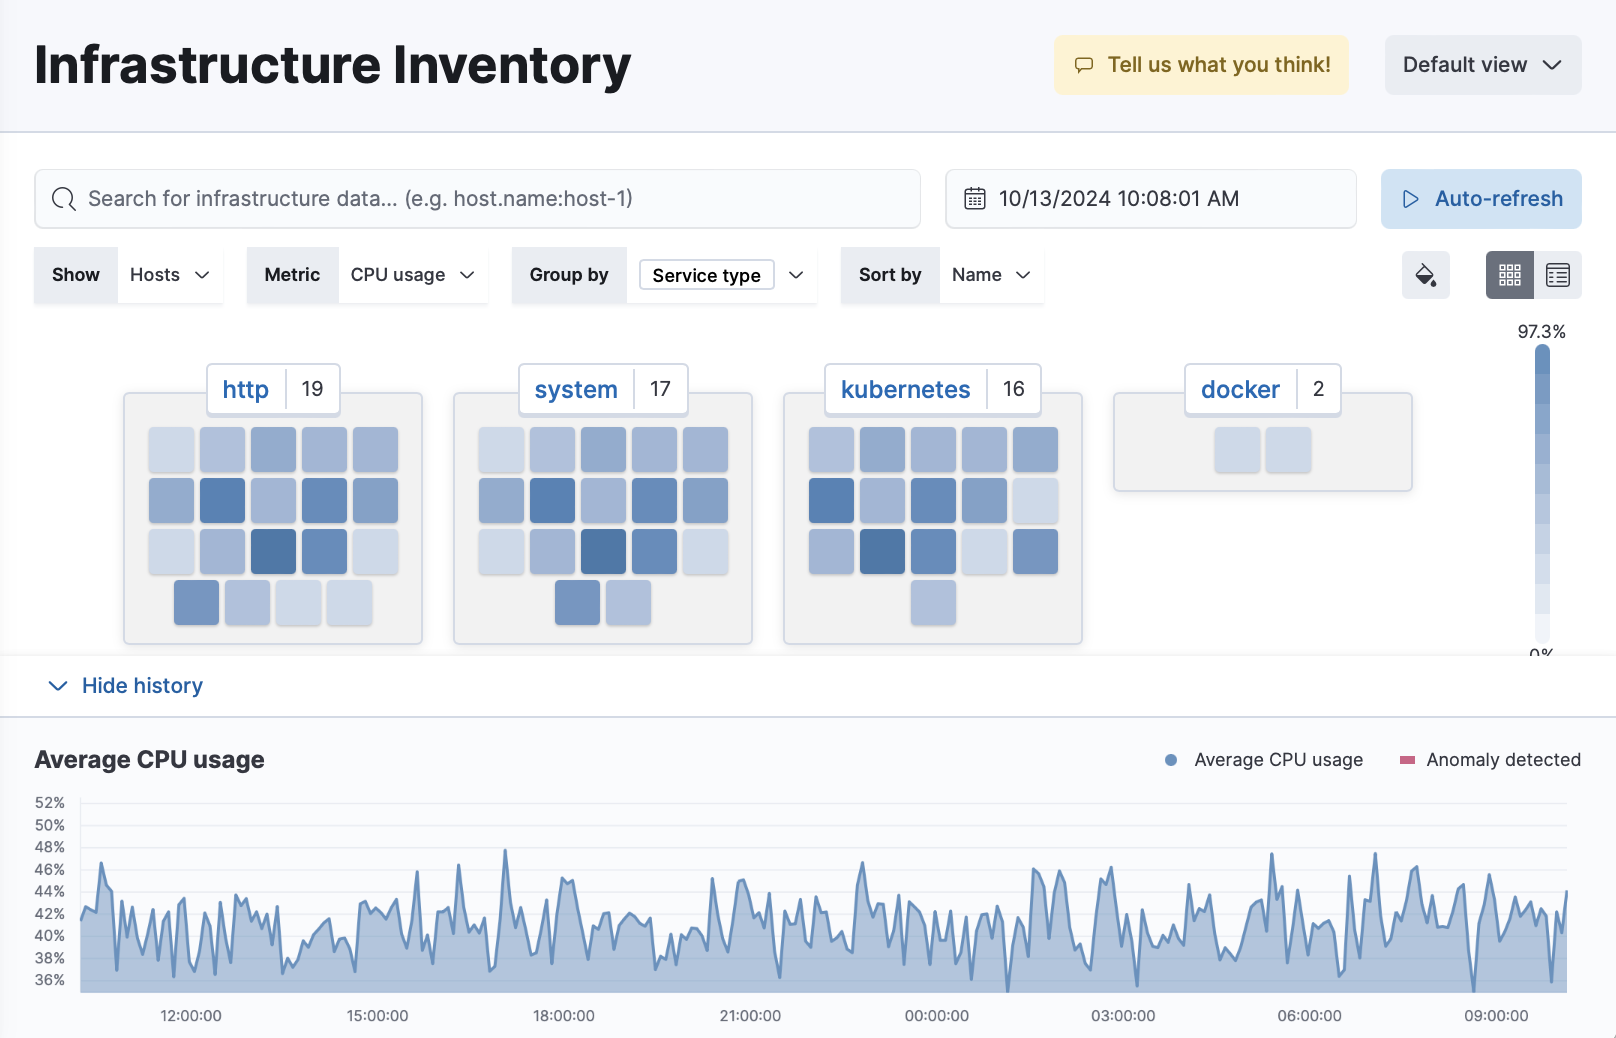
The Infrastructure Inventory page provides a metrics-driven view of your entire infrastructure grouped by the resources you are monitoring. All monitored resources emitting a core set of infrastructure metrics are displayed to give you a quick view of the overall health of your infrastructure.
To open Infrastructure inventory, find Infrastructure in the main menu or use the global search field.
To learn more about the metrics shown on this page, refer to the Metrics reference.
Don’t see any metrics?
If you haven’t added data yet, click Add data to search for and install an Elastic integration.
Need help getting started? Follow the steps in Get started with system metrics.
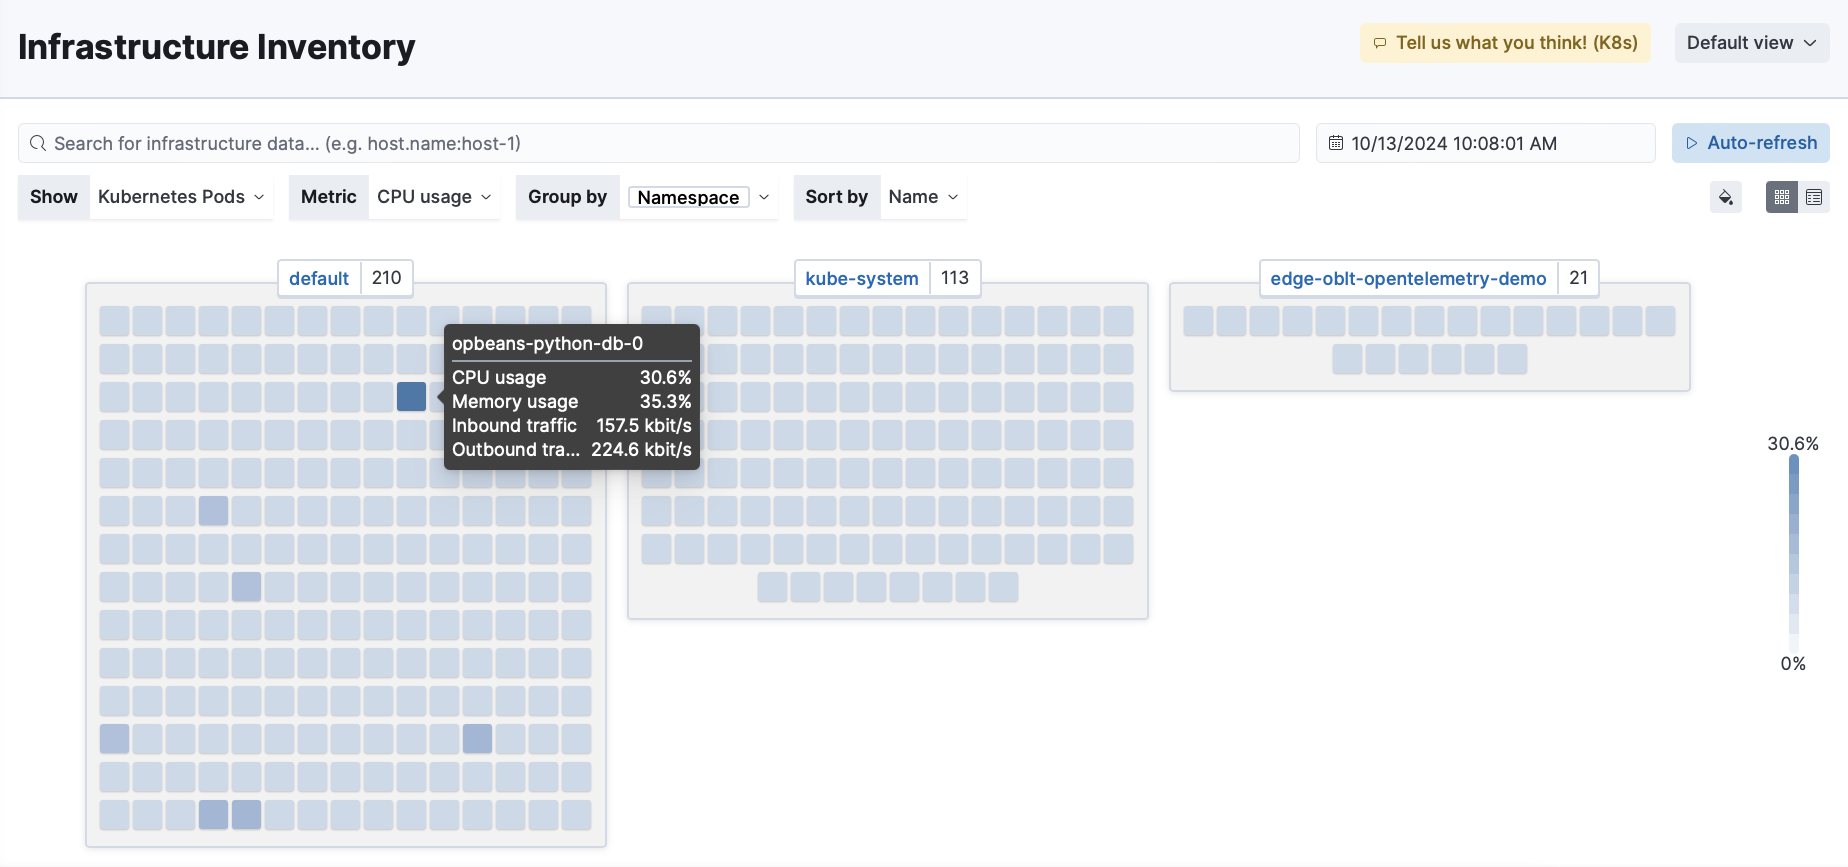
To get started with your analysis, select the type of resources you want to show in the high-level view. From the Show menu, select one of the following:
- Hosts — the default
- Kubernetes Pods
- Docker Containers — shows all containers, not just Docker
- AWS — includes EC2 instances, S3 buckets, RDS databases, and SQS queues
When you hover over each resource in the waffle map, the metrics specific to that resource are displayed.
You can sort by resource, group the resource by specific fields related to it, and sort by either name or metric value. For example, you can filter the view to display the memory usage of your Kubernetes pods, grouped by namespace, and sorted by the memory usage value.
You can also use the search bar to create structured queries using Kibana Query Language. For example, enter host.hostname : "host1" to view only the information for host1.
To examine the metrics for a specific time, use the time filter to select the date and time.
By default the Infrastructure Inventory page displays a waffle map that shows the hosts you are monitoring and the current CPU usage for each host. Alternatively, you can click the Table view icon ![]() to switch to a table view.
to switch to a table view.
Without leaving the Infrastructure Inventory page, you can view enhanced metrics relating to each host running in your infrastructure. On the waffle map, select a host to display the host details overlay.
To expand the overlay and view more detail, click Open as page in the upper-right corner.
The host details overlay contains the following tabs:
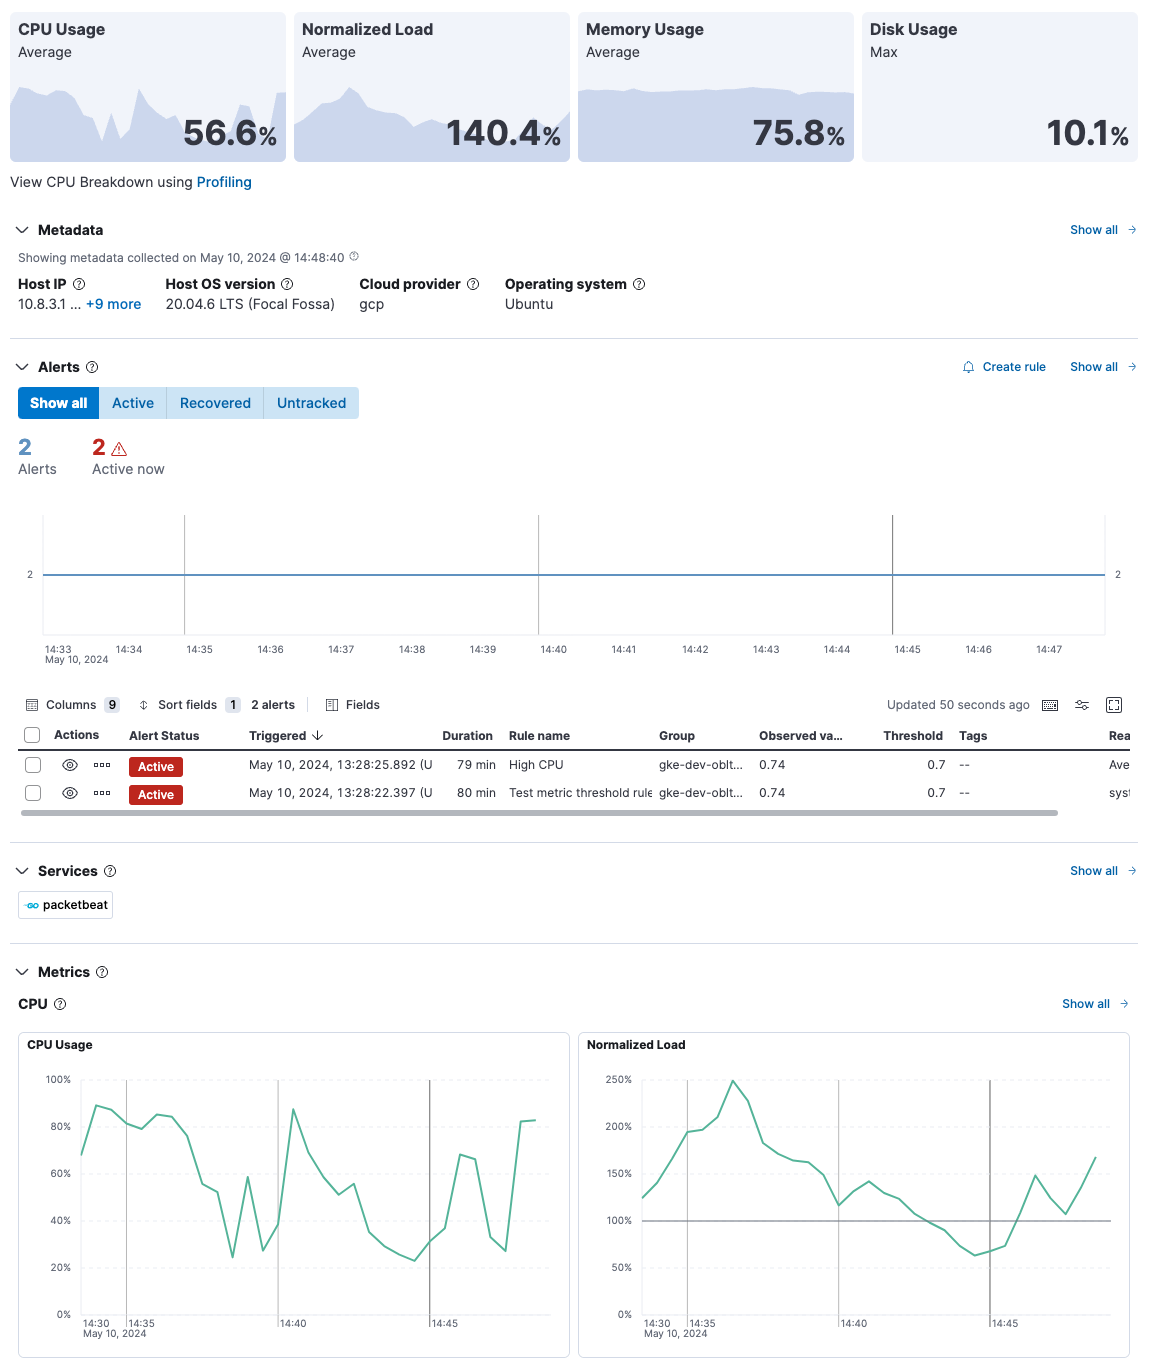
Overview
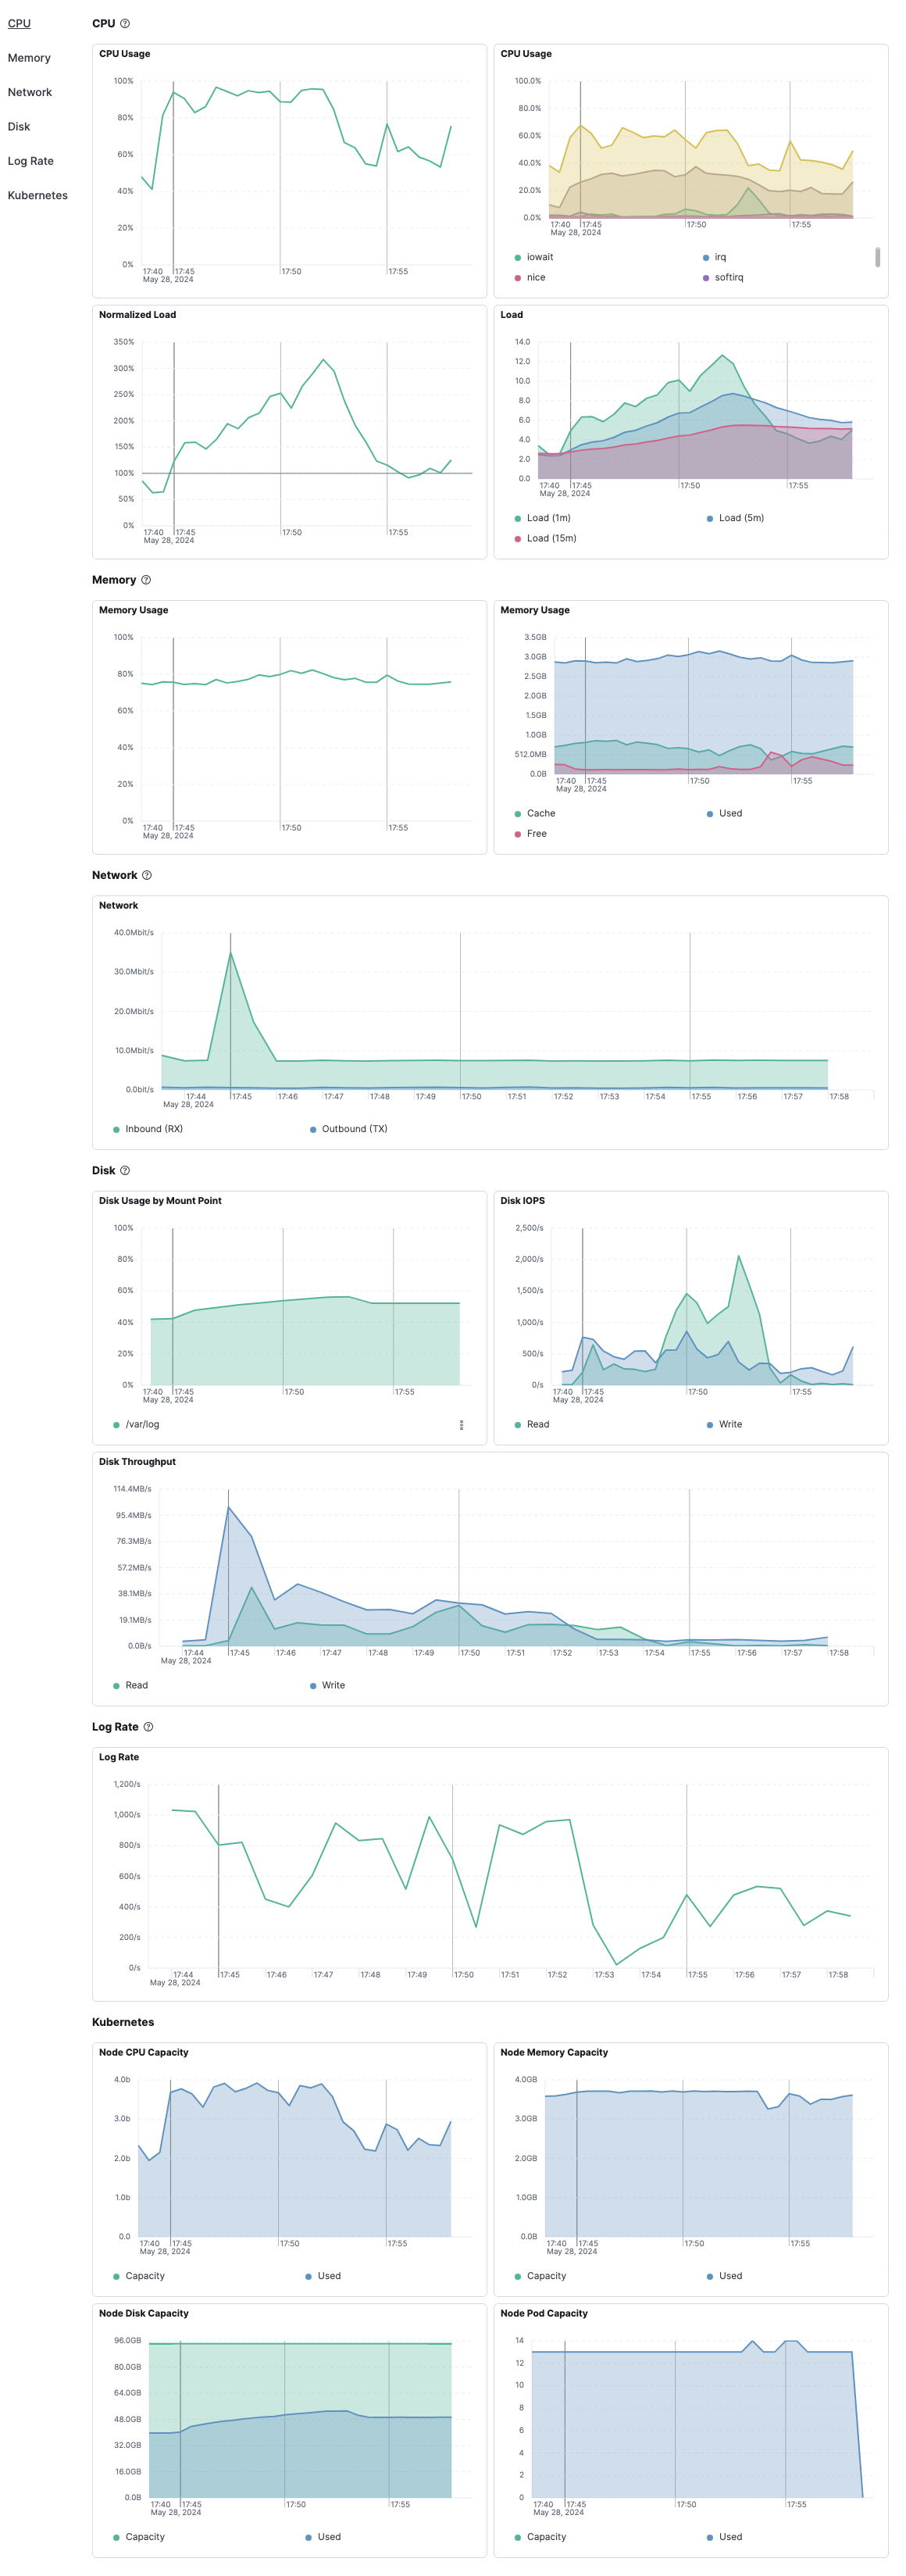
The Overview tab displays key metrics about the selected host, such as CPU usage, normalized load, memory usage, and max disk usage.
Change the time range to view metrics over a specific period of time.
Expand each section to view more detail related to the selected host, such as metadata, active alerts, services detected on the host, and metrics.
Hover over a specific time period on a chart to compare the various metrics at that given time.
Click Show all to drill down into related data.
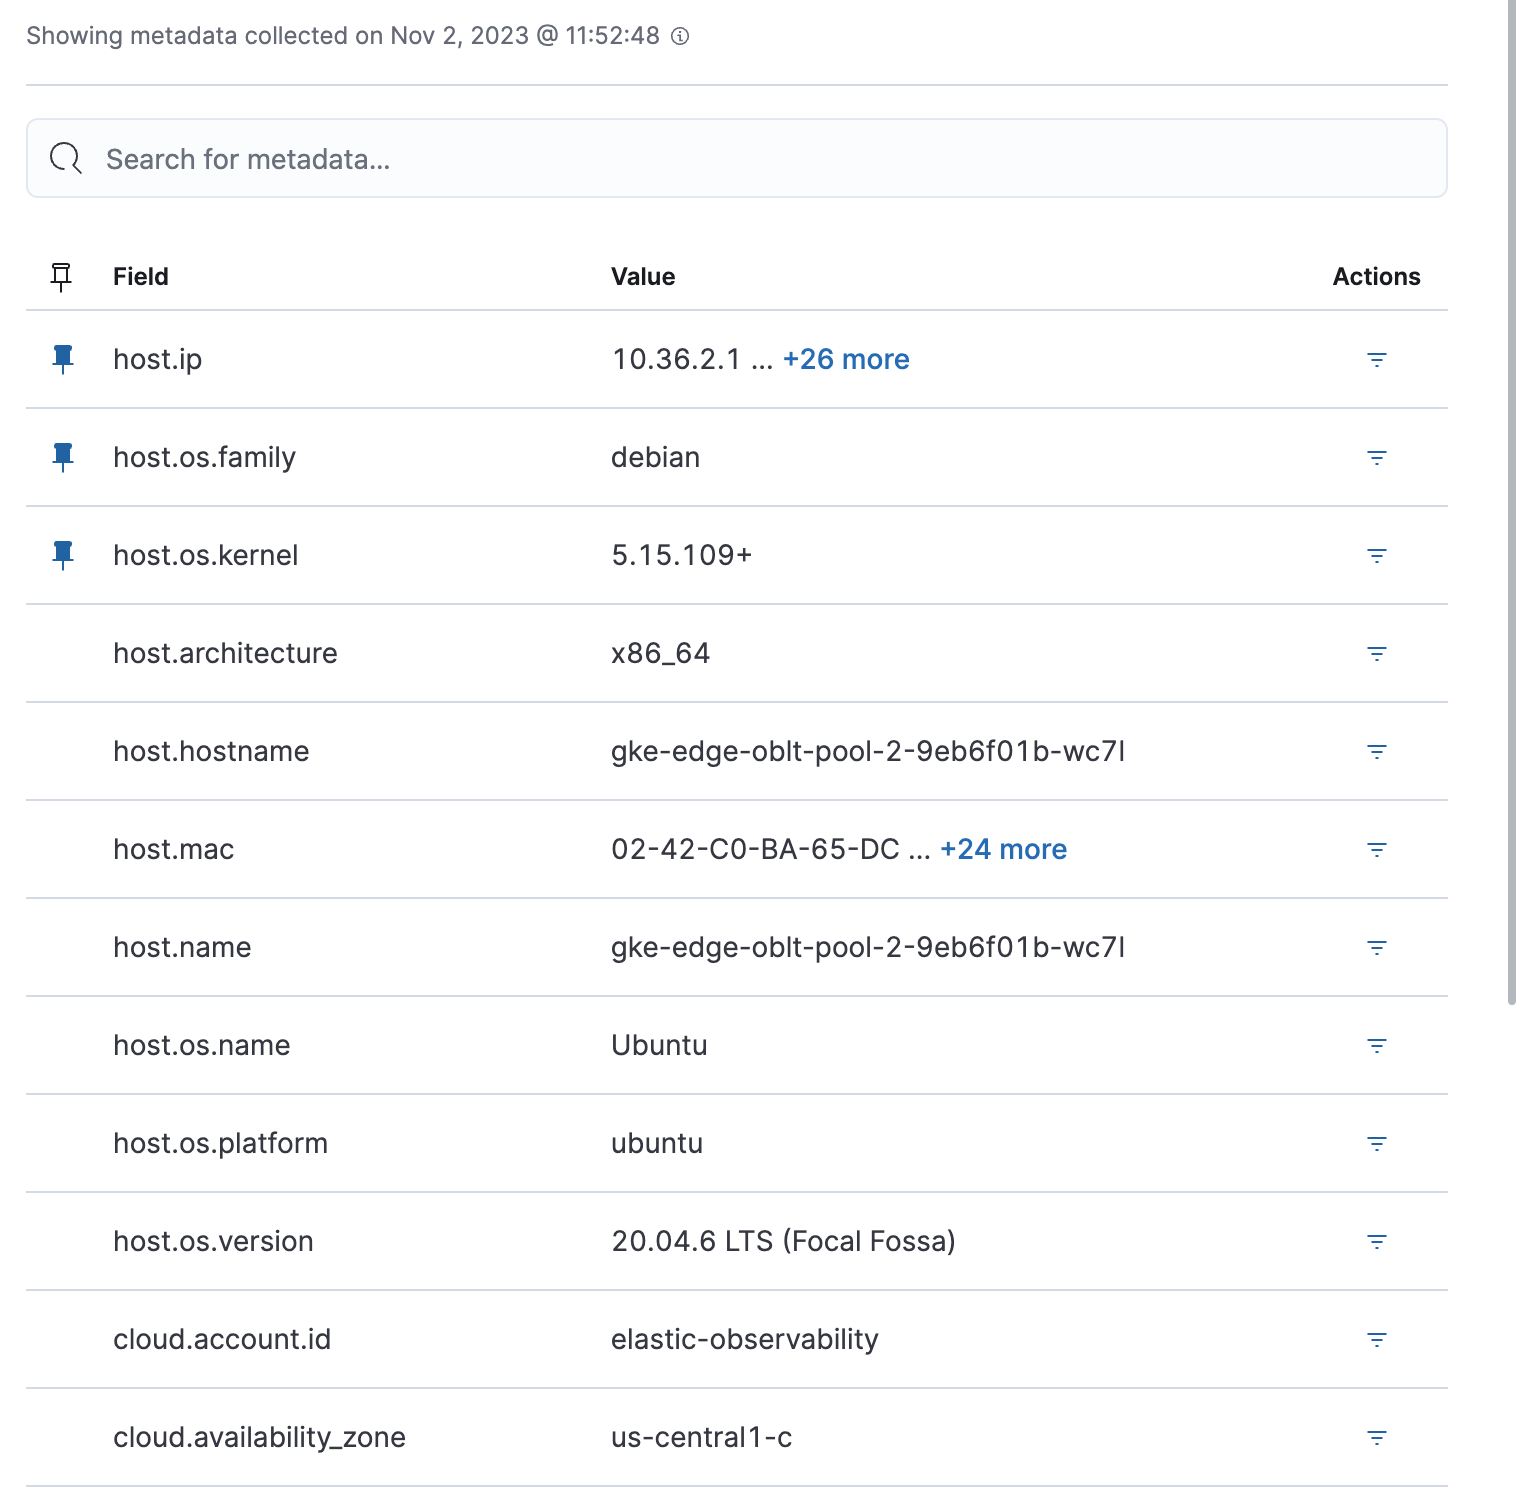
Metadata
The Metadata tab lists all the meta information relating to the host, including host, cloud, and agent information.
This information can help when investigating events—for example, when filtering by operating system or architecture.
Metrics
The Metrics tab shows host metrics organized by type and is more complete than the view available in the Overview tab.
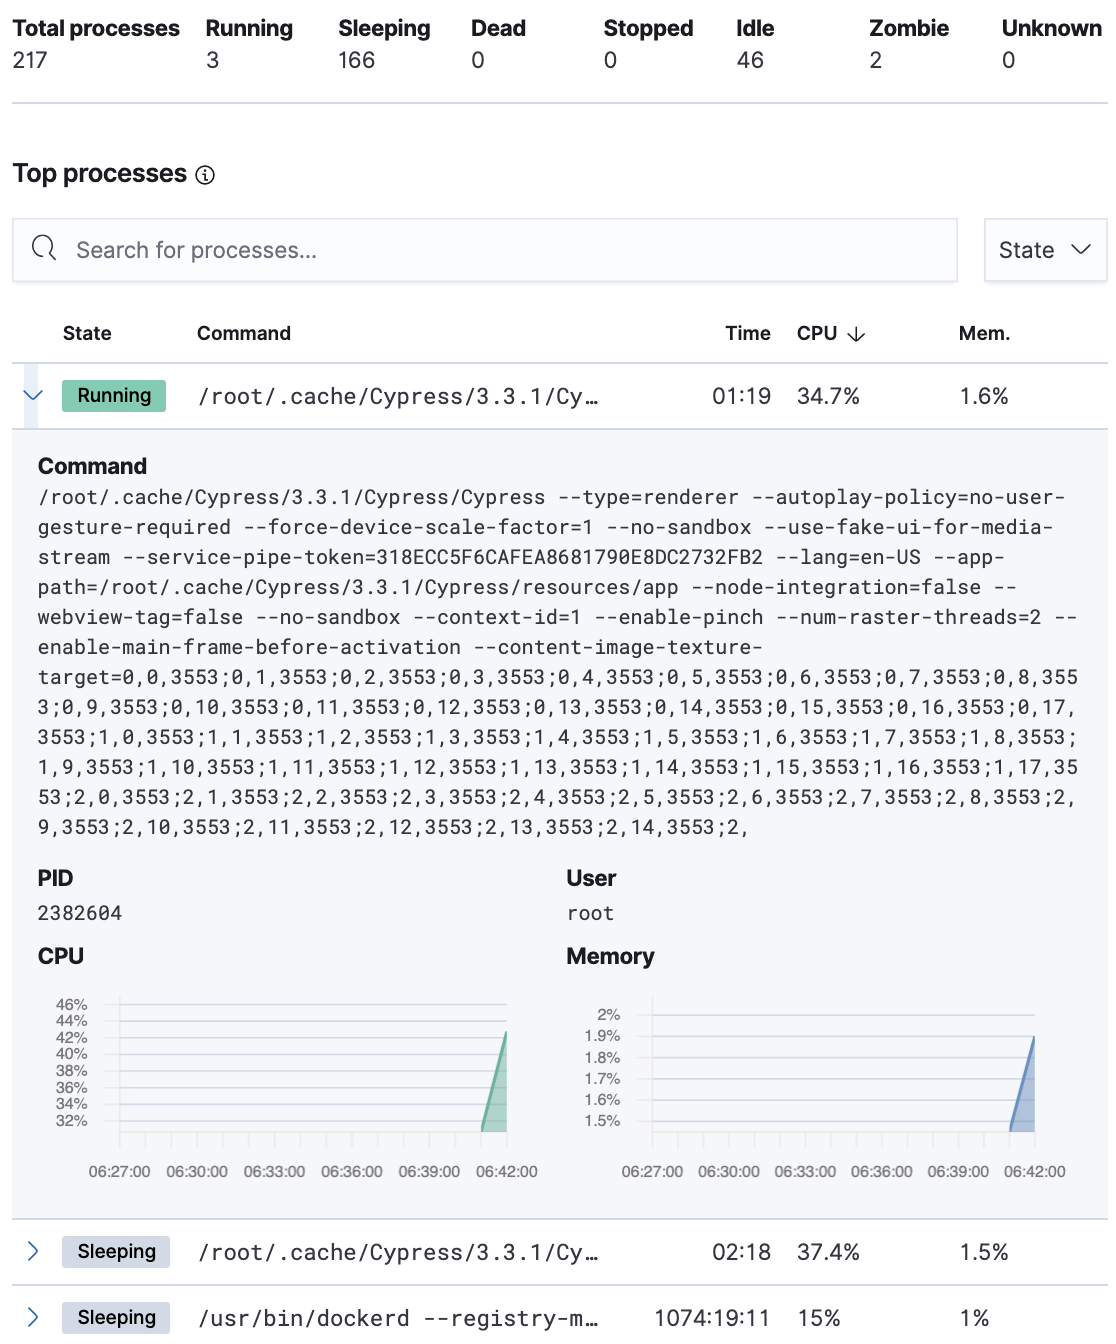
Processes
The Processes tab lists the total number of processes (system.process.summary.total) running on the host, along with the total number of processes in these various states:
- Running (
system.process.summary.running) - Sleeping (
system.process.summary.sleeping) - Stopped (
system.process.summary.stopped) - Idle (
system.process.summary.idle) - Dead (
system.process.summary.dead) - Zombie (
system.process.summary.zombie) - Unknown (
system.process.summary.unknown)
The processes listed in the Top processes table are based on an aggregation of the top CPU and the top memory consuming processes. The number of top processes is controlled by process.include_top_n.by_cpu and process.include_top_n.by_memory.
| Command | Full command line that started the process, including the absolute path to the executable, and all the arguments (system.process.cmdline). |
| PID | Process id (process.pid). |
| User | User name (user.name). |
| CPU | The percentage of CPU time spent by the process since the last event (system.process.cpu.total.pct). |
| Time | The time the process started (system.process.cpu.start_time). |
| Memory | The percentage of memory (system.process.memory.rss.pct) the process occupied in main memory (RAM). |
| State | The current state of the process and the total number of processes (system.process.state). Expected values are: running, sleeping, dead, stopped, idle, zombie, and unknown. |
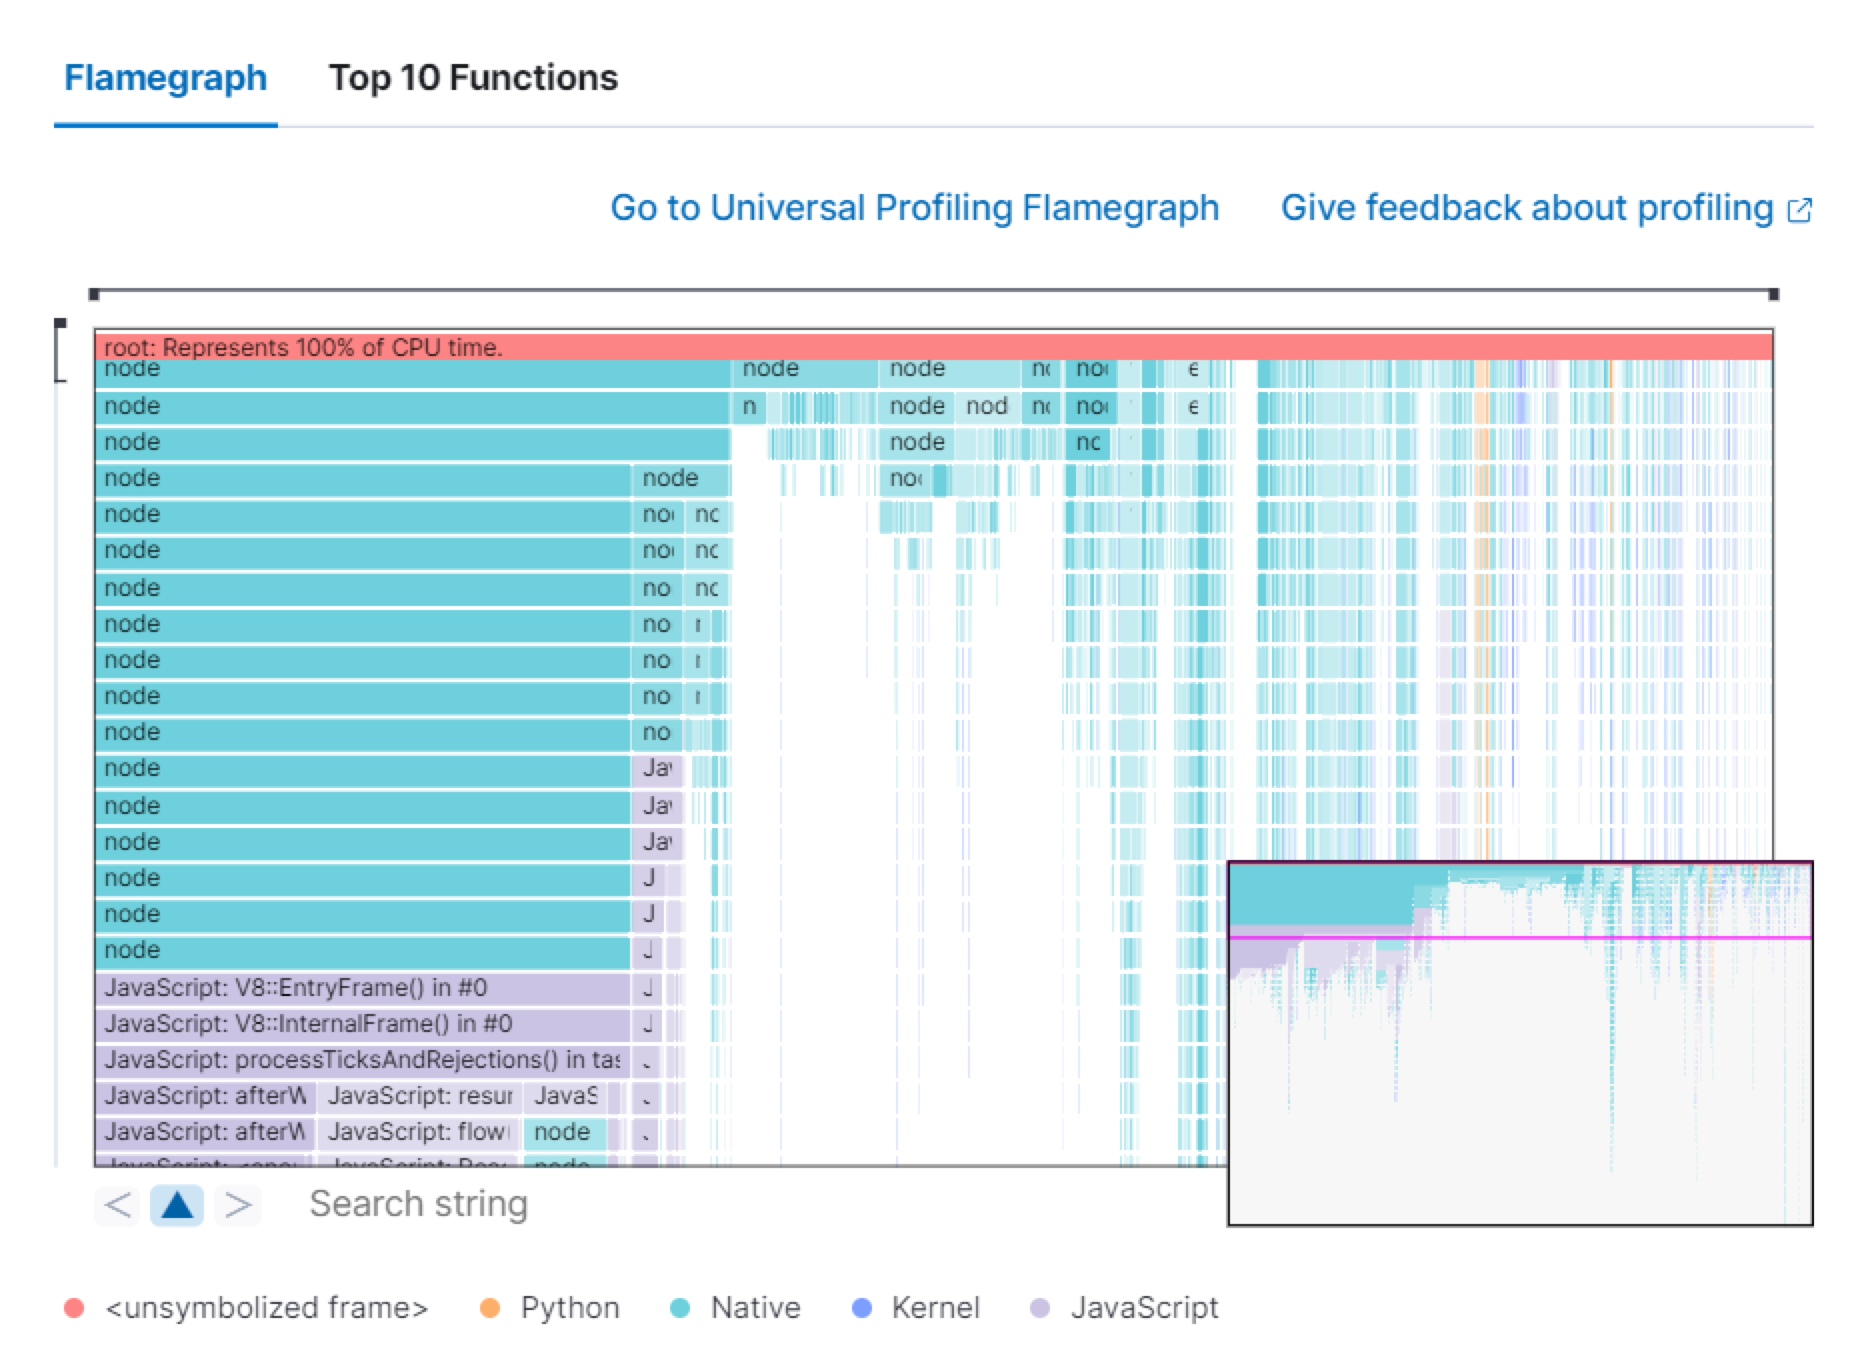
Universal Profiling
The Universal Profiling tab shows CPU usage down to the application code level. From here, you can find the sources of resource usage, and identify code that can be optimized to reduce infrastructure costs. The Universal Profiling tab has the following views.
| Flamegraph | A visual representation of the functions that consume the most resources. Each rectangle represents a function. The rectangle width represents the time spent in the function. The number of stacked rectangles represents the stack depth, or the number of functions called to reach the current function. |
| Top 10 Functions | A list of the most expensive lines of code on your host. See the most frequently sampled functions, broken down by CPU time, annualized CO2, and annualized cost estimates. |
For more on Universal Profiling, refer to the Universal Profiling docs.
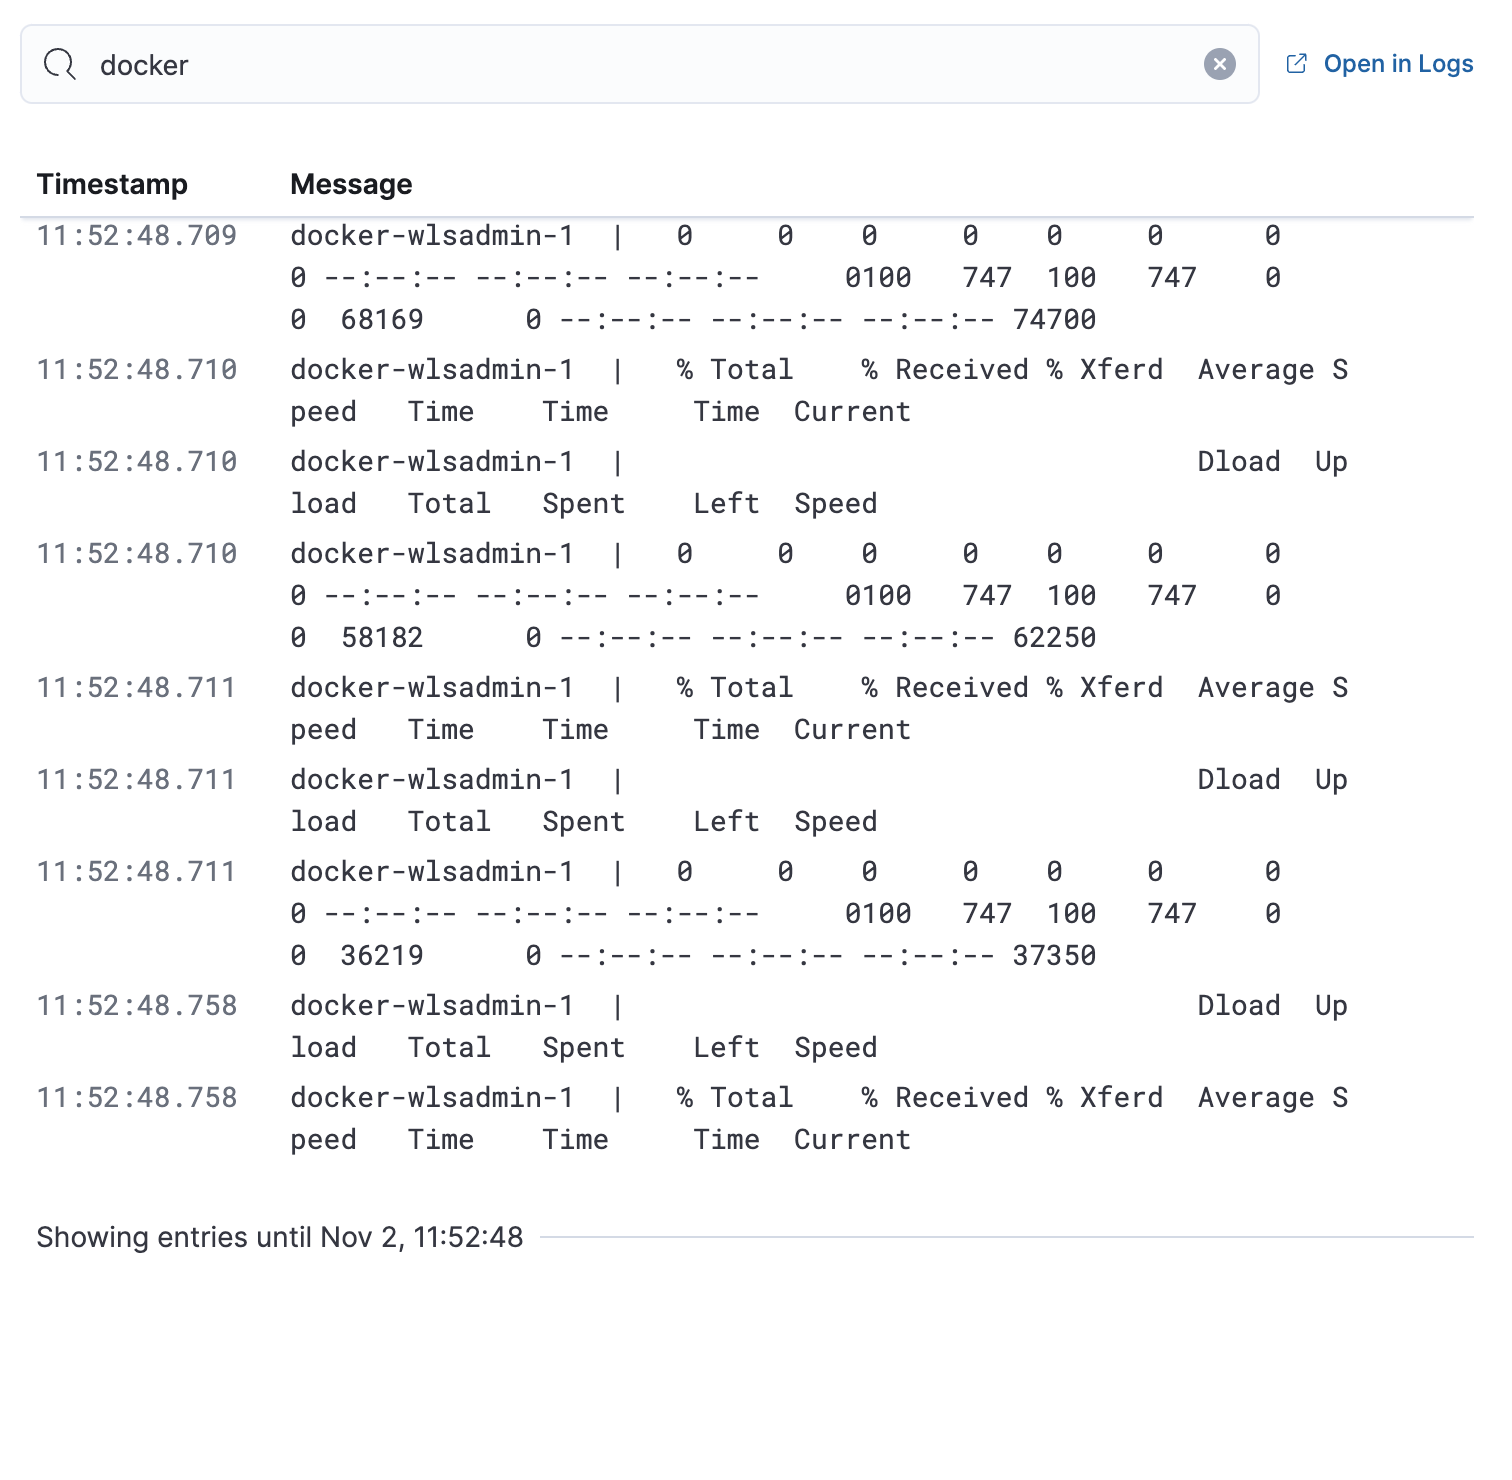
Logs
The Logs tab displays logs relating to the host that you have selected. By default, the logs tab displays the following columns.
| Timestamp | The timestamp of the log entry from the timestamp field. |
| Message | The message extracted from the document. The content of this field depends on the type of log message. If no special log message type is detected, the Elastic Common Schema (ECS) base field, message, is used. |
To view the logs in the Logs app for a detailed analysis, click Open in Logs.
Anomalies
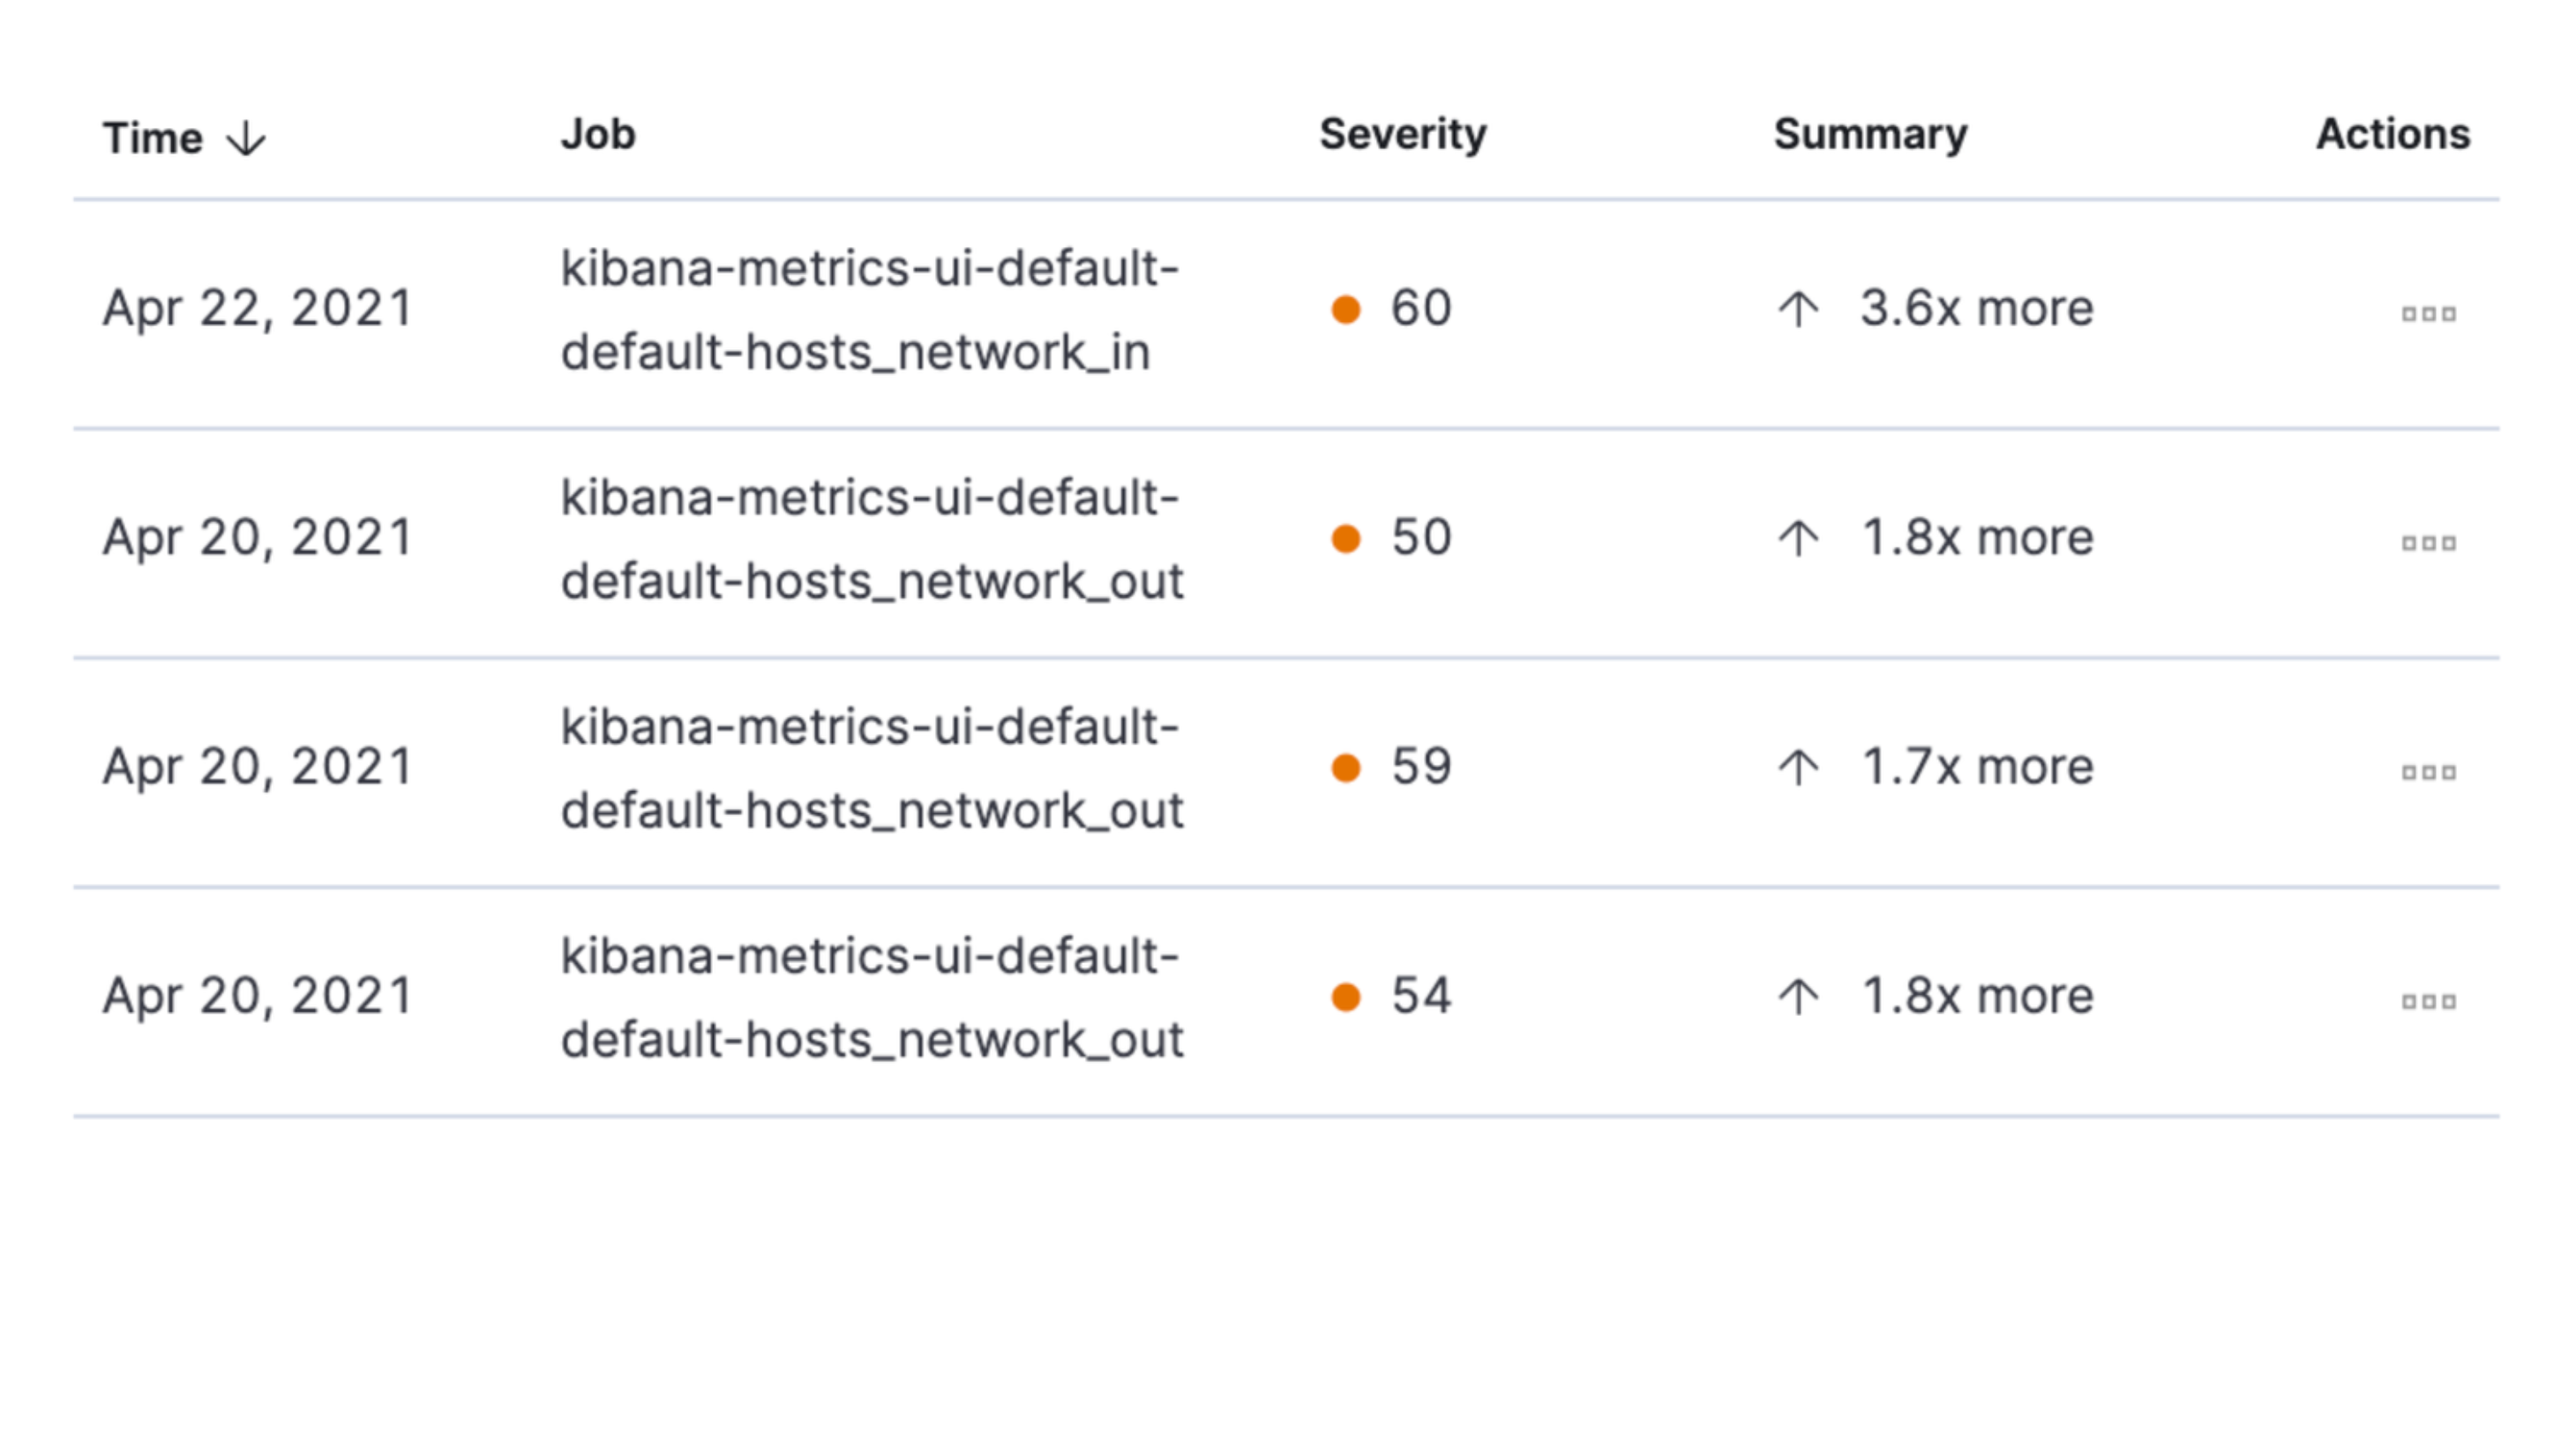
The Anomalies tab displays a list of each single metric anomaly detection job for the specific host. By default, anomaly jobs are sorted by time, showing the most recent jobs first.
Along with the name of each anomaly job, detected anomalies with a severity score equal to 50 or higher are listed. These scores represent a severity of "warning" or higher in the selected time period. The summary value represents the increase between the actual value and the expected ("typical") value of the host metric in the anomaly record result.
To drill down and analyze the metric anomaly, select Actions → Open in Anomaly Explorer. You can also select Actions → Show in Inventory to view the host Inventory page, filtered by the specific metric.
Osquery
For Observability serverless projects, one of the following roles is required to use Osquery.
- Admin: Has full access to project configuration, including the ability to install, manage, and run Osquery queries through Elastic Agent. This role supports both ad hoc (live) queries and scheduled queries against monitored hosts. Admins can view and analyze the results directly in Elasticsearch.
- Editor: Has limited access. Editors can run pre-configured queries, but may have restricted permissions for setting up and scheduling new queries, especially queries that require broader access or permissions adjustments.
- Viewer: Has read-only access to data, including viewing Osquery results if configured by a user with higher permissions. Viewers cannot initiate or schedule Osquery queries themselves.
To learn more about roles, refer to Assign user roles and privileges.
You must have an active Elastic Agent with an assigned agent policy that includes the Osquery Manager integration.
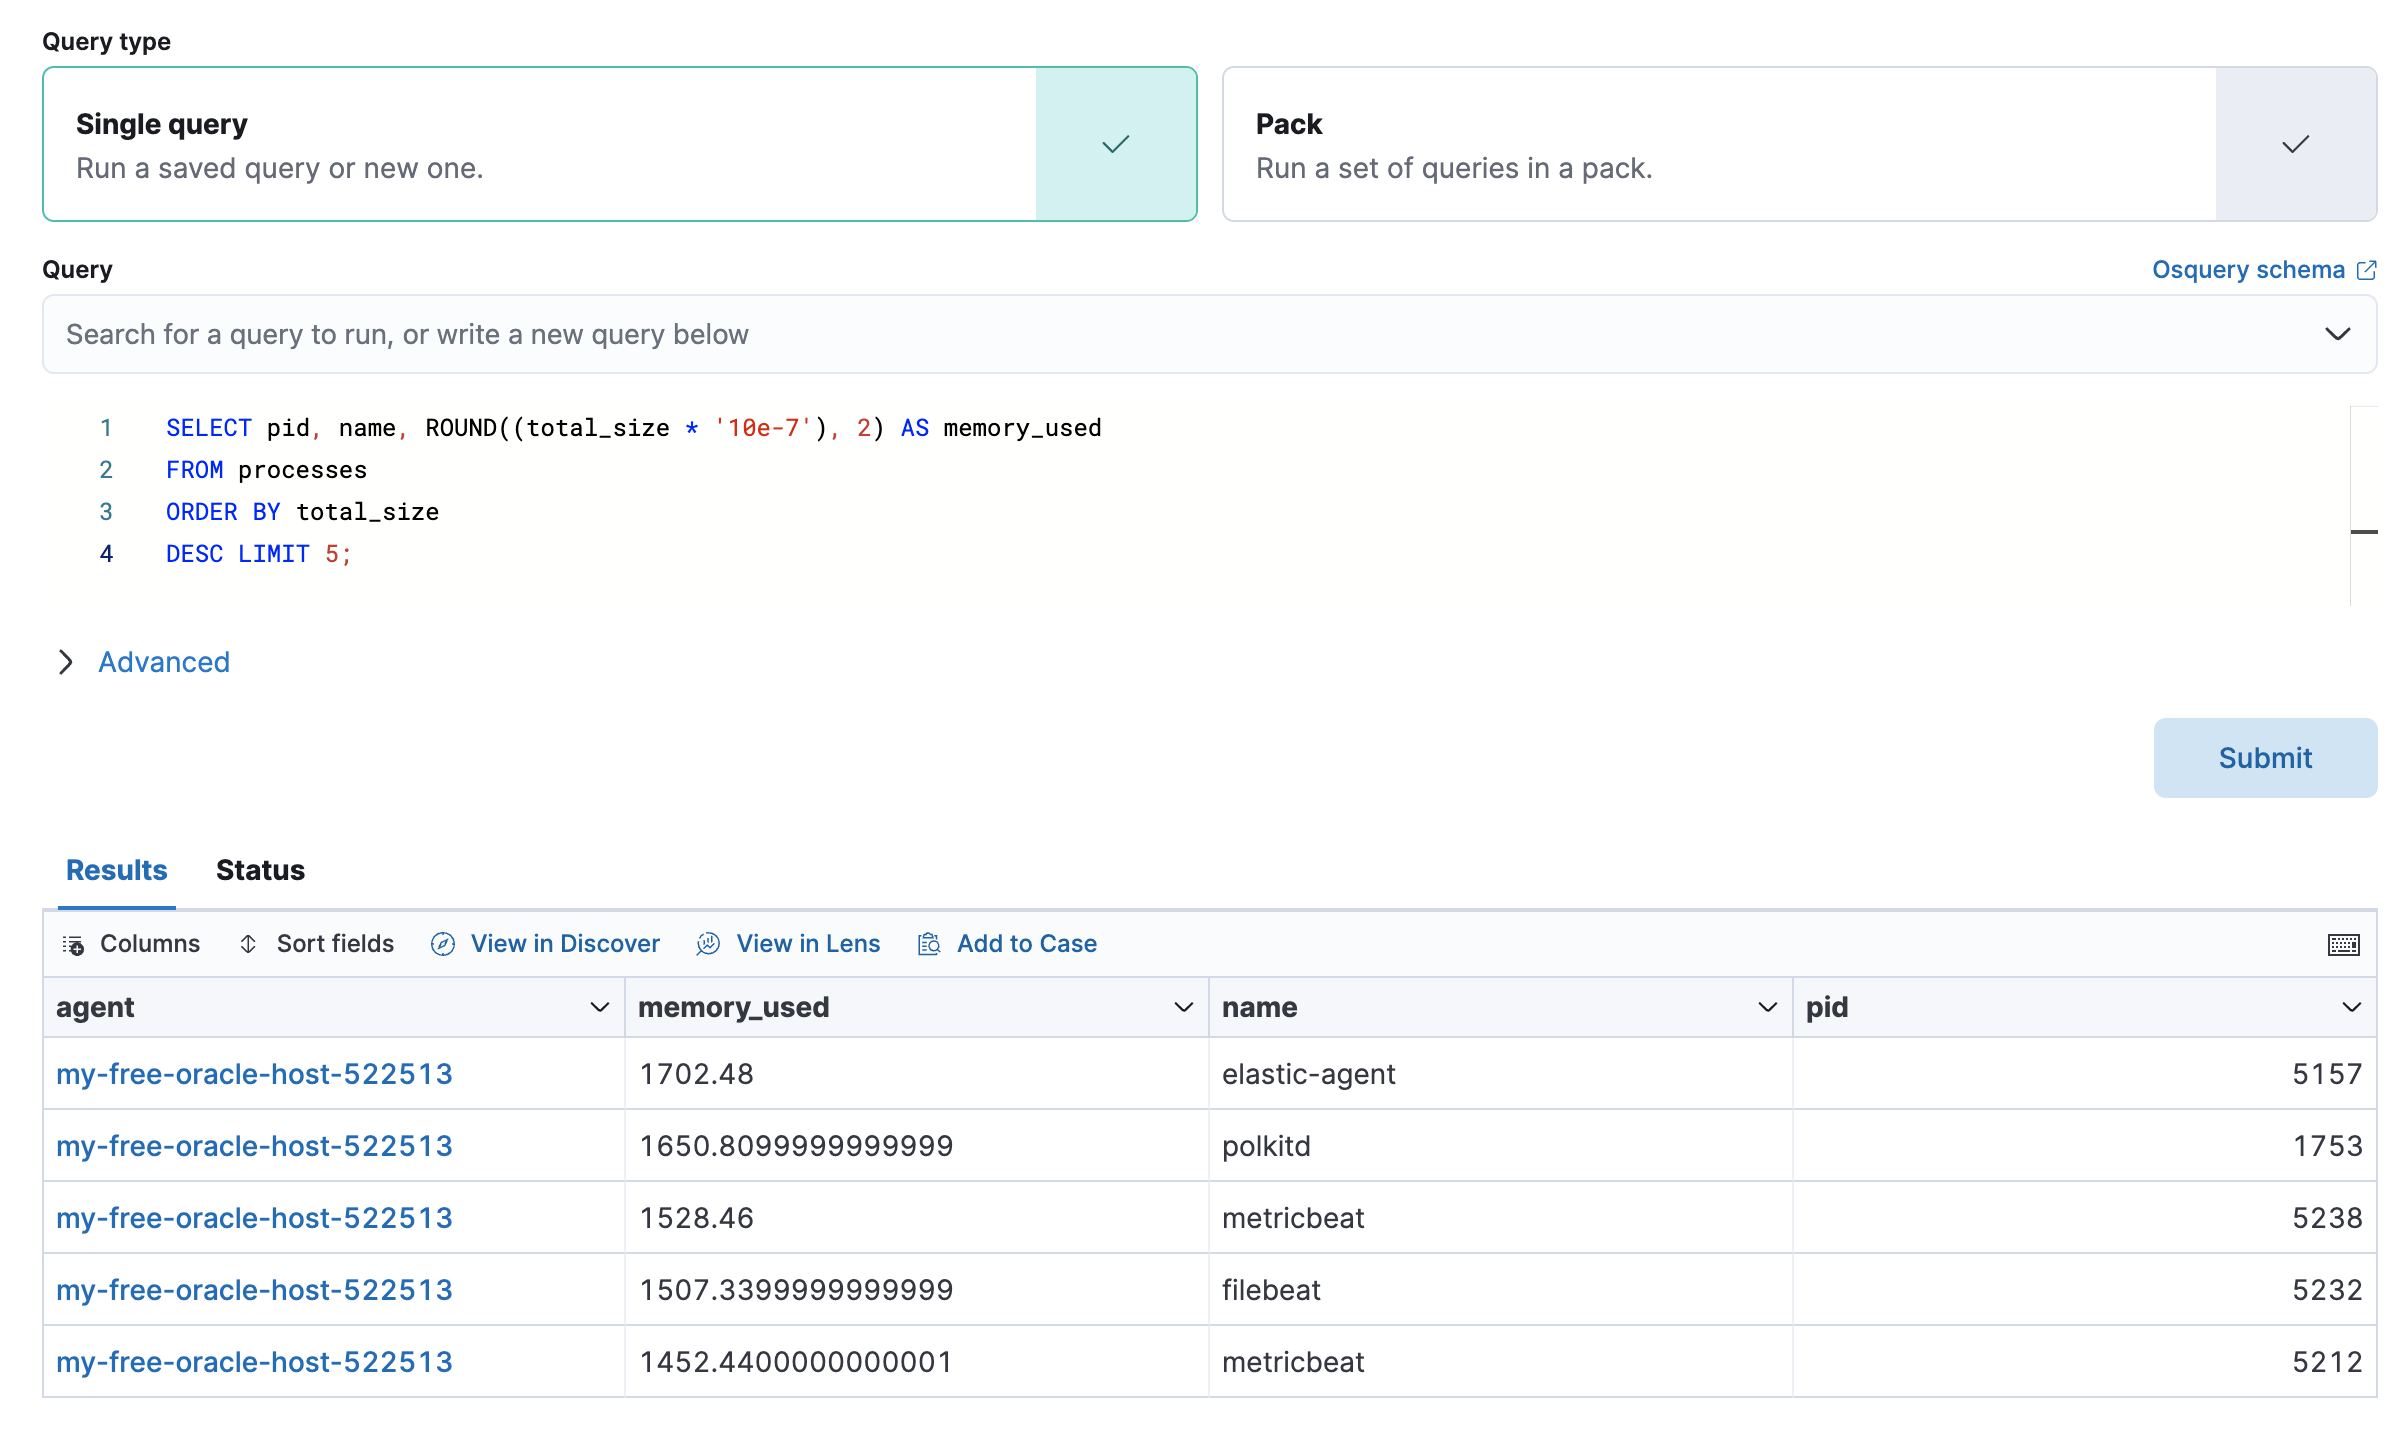
The Osquery tab allows you to build SQL statements to query your host data. You can create and run live or saved queries against the Elastic Agent. Osquery results are stored in Elasticsearch so that you can use the Elastic Stack to search, analyze, and visualize your host metrics. To create saved queries and add scheduled query groups, refer to Osquery.
To view more information about the query, click the Status tab. A query status can result in success, error (along with an error message), or pending (if the Elastic Agent is offline).
Other options include:
- View in Discover to search, filter, and view information about the structure of host metric fields. To learn more, refer to Discover.
- View in Lens to create visualizations based on your host metric fields. To learn more, refer to Lens.
- View the results in full screen mode.
- Add, remove, reorder, and resize columns.
- Sort field names in ascending or descending order.
These metrics are also available when viewing hosts on the Hosts page.
When you select Docker containers, the Infrastructure inventory page displays a waffle map that shows the containers you are monitoring and the current CPU usage for each container. Alternatively, you can click the Table view icon ![]() to switch to a table view.
to switch to a table view.
Without leaving the Infrastructure inventory page, you can view enhanced metrics relating to each container running in your infrastructure.
Why do some containers report 0% or null (-) values in the waffle map?
The waffle map shows all monitored containers, including containerd, provided that the data collected from the container has the container.id field. However, the waffle map currently only displays metrics for Docker fields. This display problem will be resolved in a future release.
On the waffle map, select a container to display the container details overlay.
To expand the overlay and view more detail, click Open as page in the upper-right corner.
The container details overlay contains the following tabs:
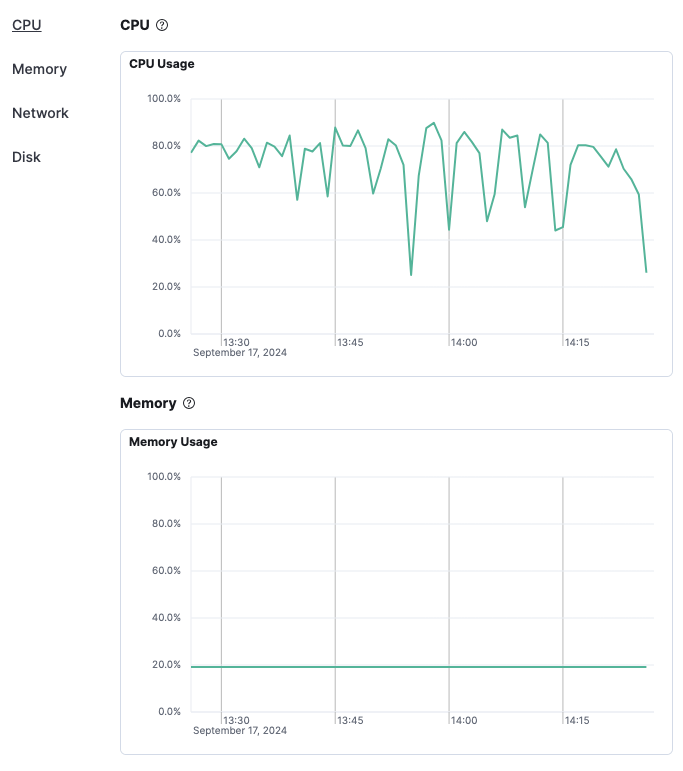
Overview
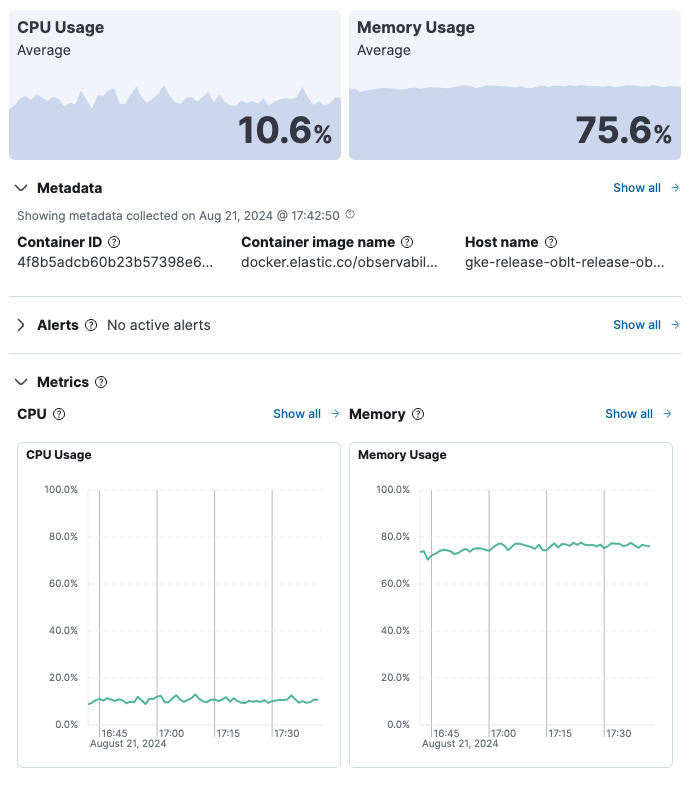
The Overview tab displays key metrics about the selected container, such as CPU, memory, network, and disk usage. The metrics shown may vary depending on the type of container you’re monitoring.
Change the time range to view metrics over a specific period of time.
Expand each section to view more detail related to the selected container, such as metadata, active alerts, and metrics.
Hover over a specific time period on a chart to compare the various metrics at that given time.
Click Show all to drill down into related data.
Metadata
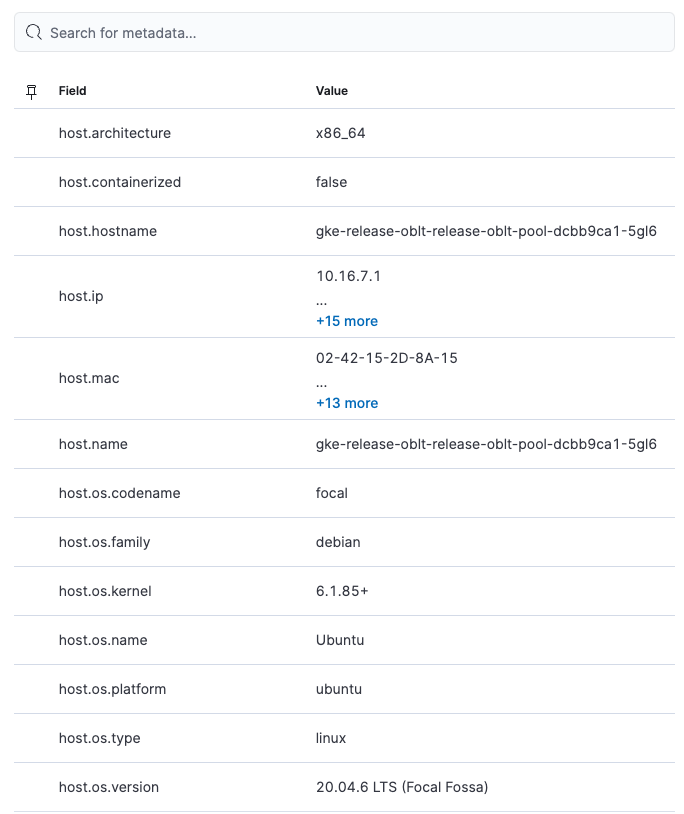
The Metadata tab lists all the meta information relating to the container:
- Host information
- Cloud information
- Agent information
All of this information can help when investigating events—for example, filtering by operating system or architecture.
Metrics
The Metrics tab shows container metrics organized by type.
Logs
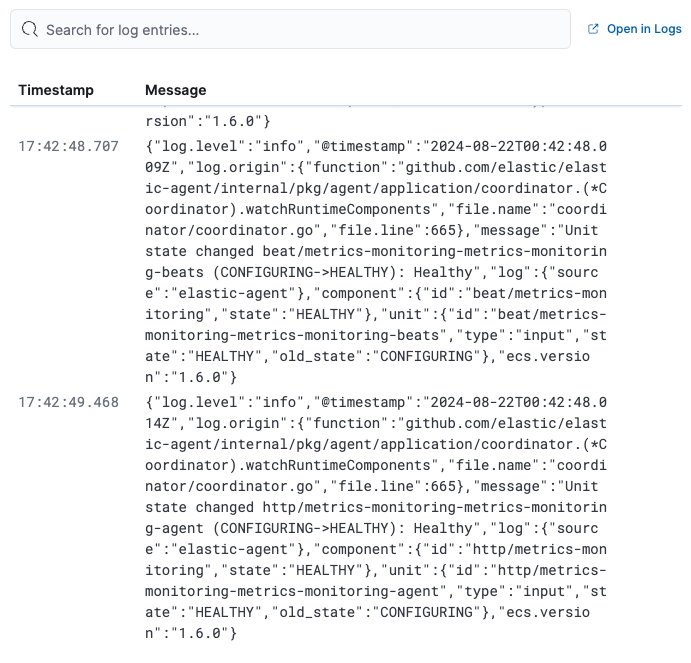
The Logs tab displays logs relating to the container that you have selected. By default, the logs tab displays the following columns.
| Timestamp | The timestamp of the log entry from the timestamp field. |
| Message | The message extracted from the document. The content of this field depends on the type of log message. If no special log message type is detected, the Elastic Common Schema (ECS) base field, message, is used. |
To view the logs in the Logs app for a detailed analysis, click Open in Logs.
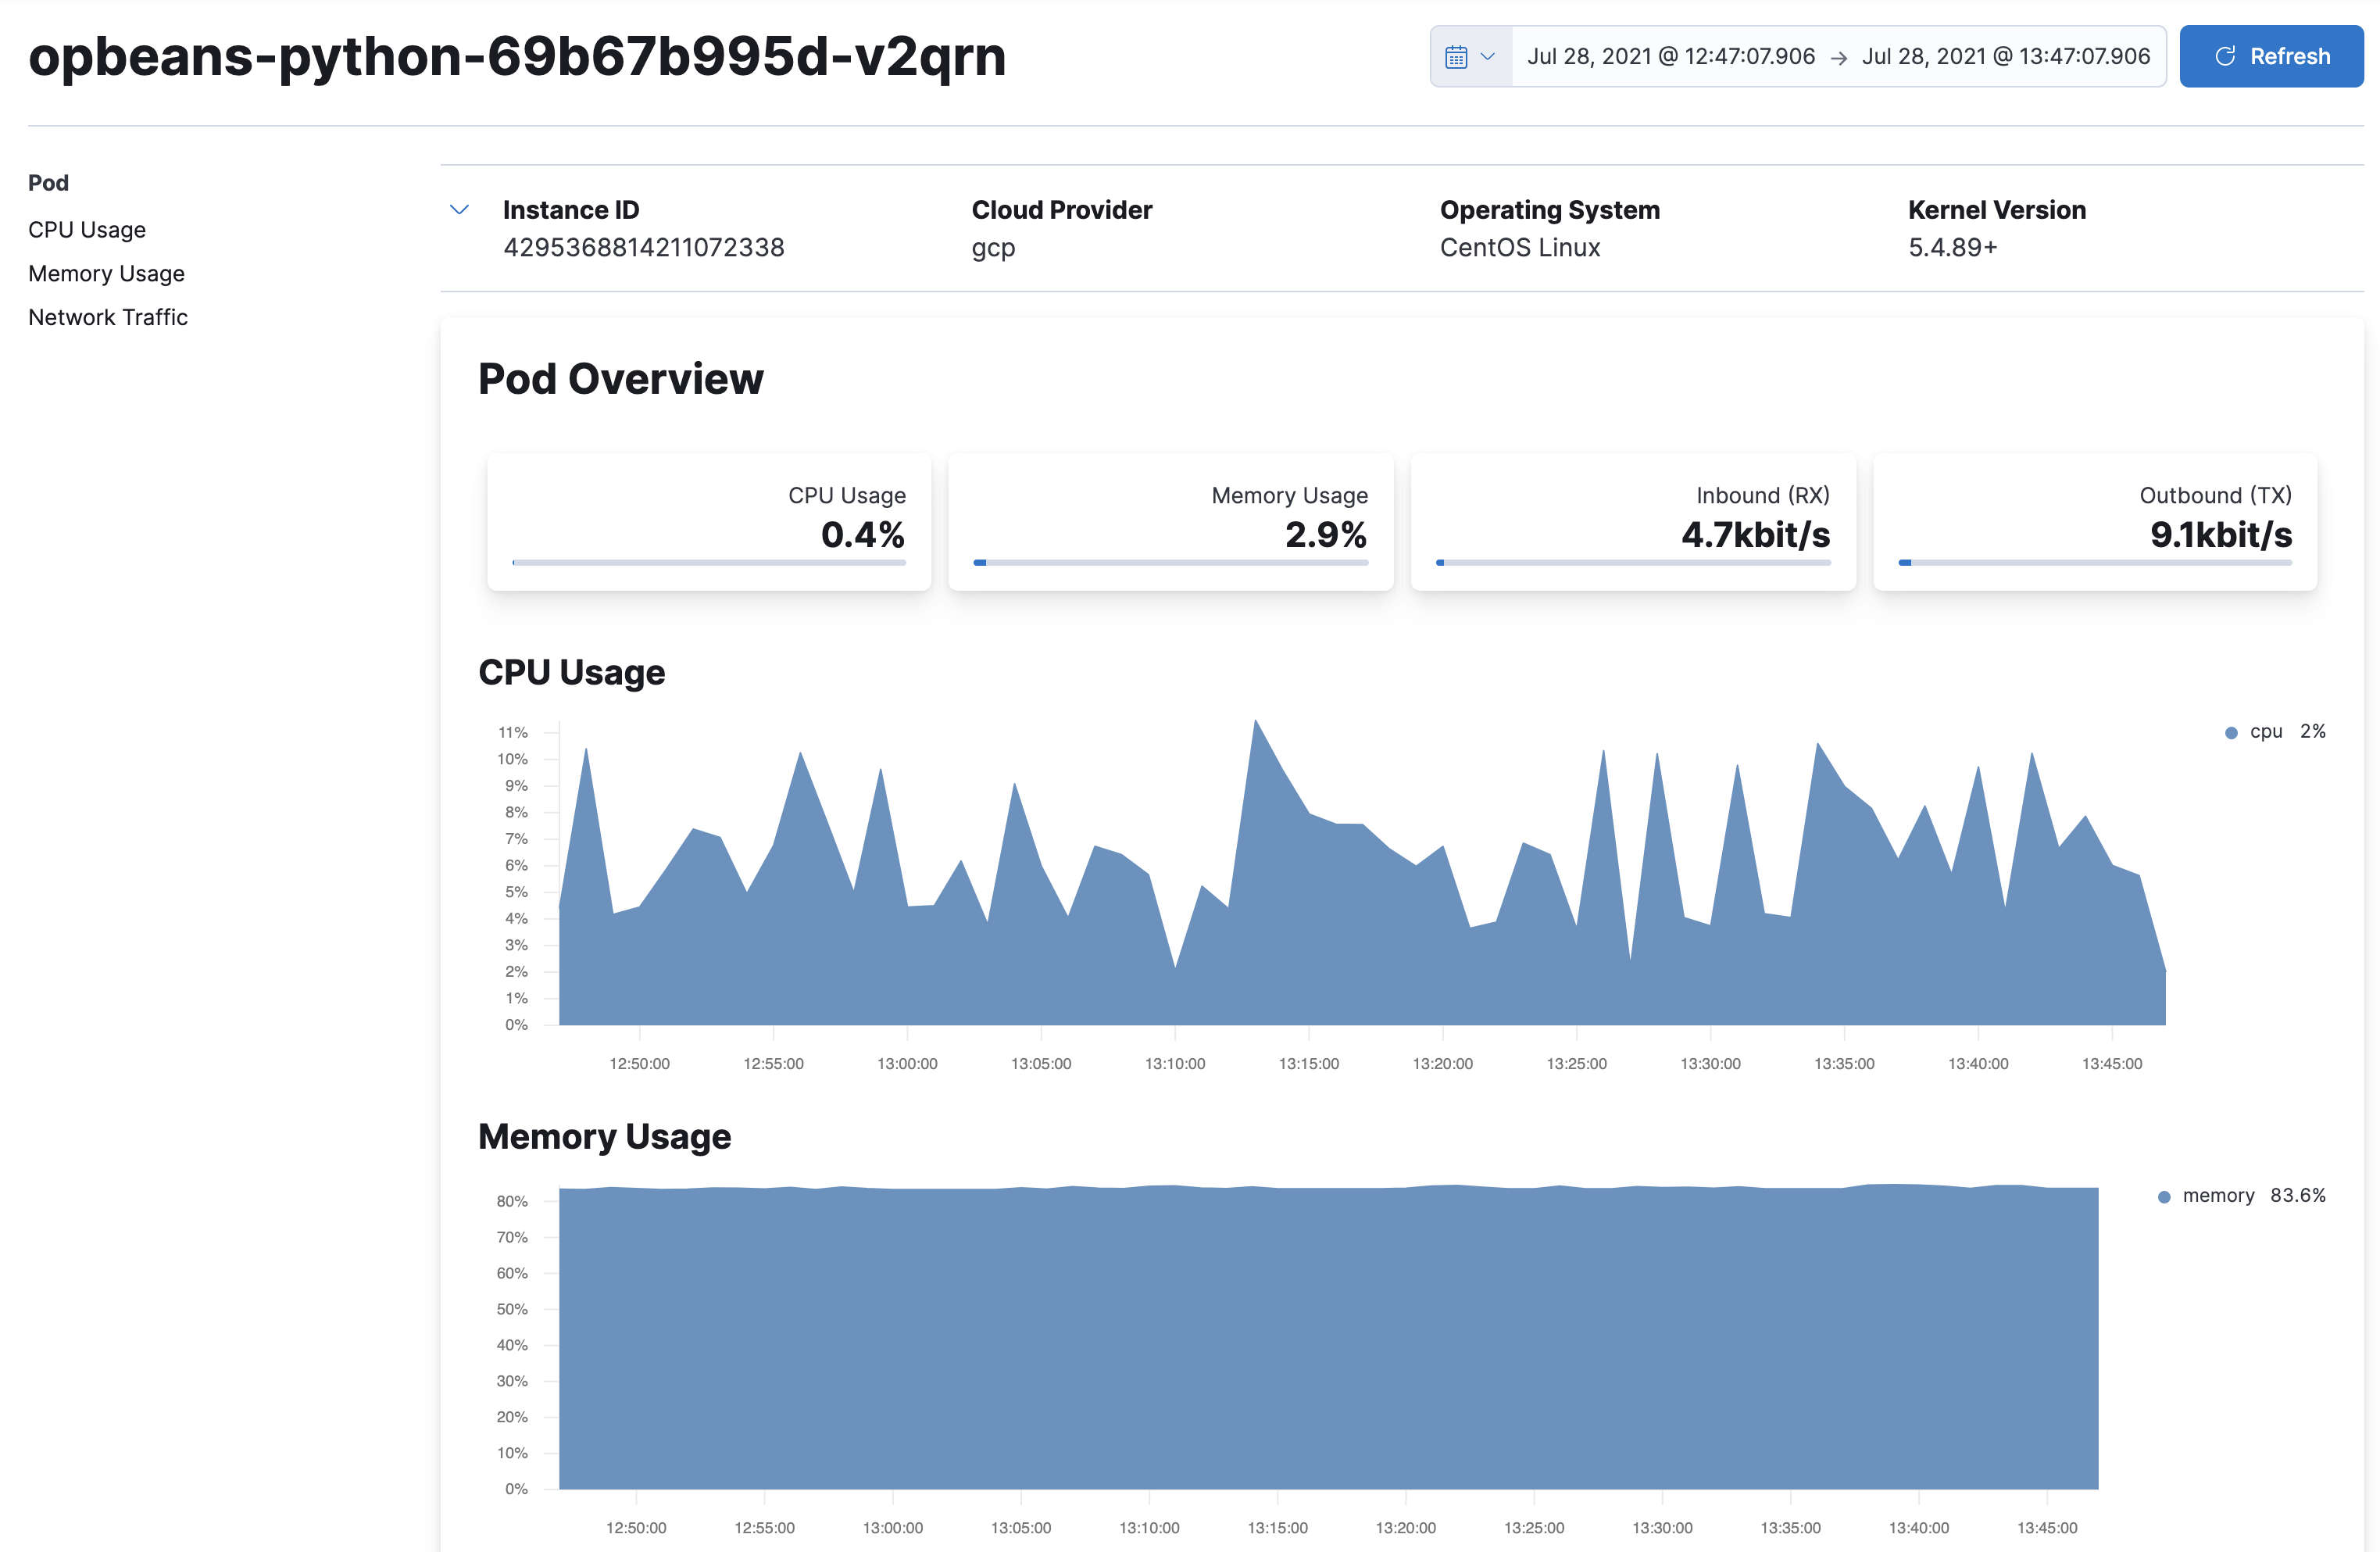
When you have searched and filtered for a specific resource, you can drill down to analyze the metrics relating to it. For example, when viewing Kubernetes Pods in the high-level view, click the Pod you want to analyze and select Kubernetes Pod metrics to see detailed metrics:
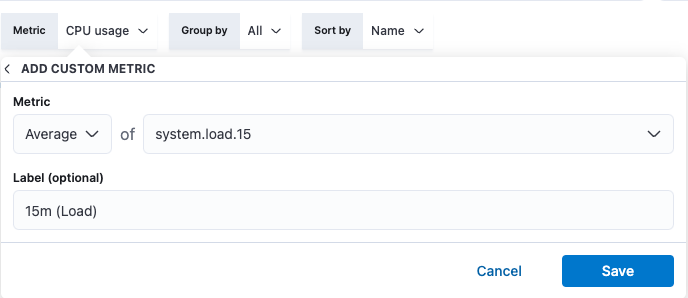
If the predefined metrics displayed on the Inventory page for each resource are not sufficient for your specific use case, you can add and define custom metrics.
Select your resource, and from the Metric filter menu, click Add metric.
Depending on the features you have installed and configured, you can view logs or traces relating to a specific resource. For example, in the high-level view, when you click a Kubernetes Pod resource, you can choose:
- Kubernetes Pod logs to view corresponding logs in the Logs app.
- Kubernetes Pod APM traces to view corresponding APM traces in the APM app.
- Kubernetes Pod in Uptime to view related uptime information in the Uptime app.