Stack monitoring
ECE ECK Elastic Cloud Hosted Self Managed
Stack monitoring allows you to collect logs and metrics from various Elastic products, including Elasticsearch nodes, Logstash nodes, Kibana instances, APM Server, and Beats in your cluster. You can also collect logs.
All of the monitoring metrics are stored in Elasticsearch, which enables you to easily visualize the data in Kibana.
If you’re using Elastic Cloud Hosted, then you can use AutoOps to monitor your cluster. AutoOps significantly simplifies cluster management with performance recommendations, resource utilization visibility, real-time issue detection and resolution paths. AutoOps is rolling out in phases across Elastic Cloud Hosted regions and cloud service providers. It will be automatically activated for your deployment, with no installation required. For more information, refer to Monitor with AutoOps.
Each monitored Elastic Stack component is considered unique in the cluster based on its persistent UUID, which is written to the path.data directory when the node or instance starts.
Monitoring documents are just ordinary JSON documents built by monitoring each Elastic Stack component at a specified collection interval. If you want to alter how these documents are structured or stored, refer to Configuring data streams/indices for monitoring.
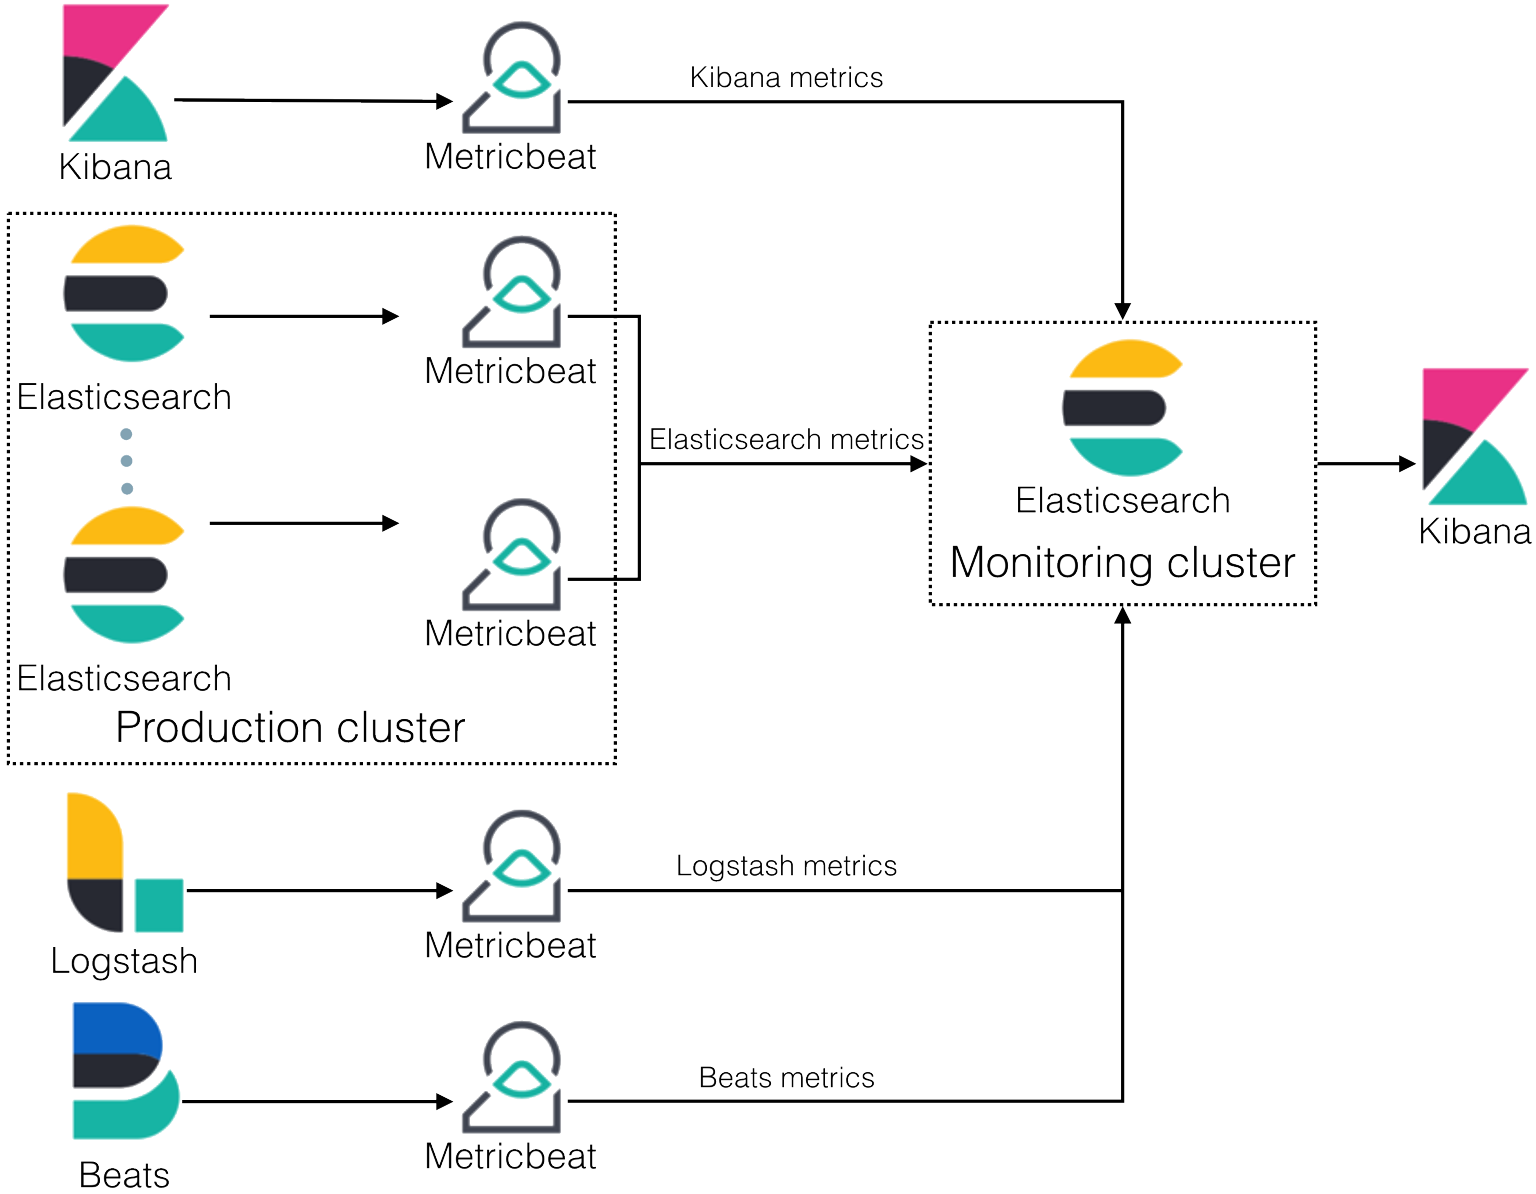
You can use Elastic Agent or Metricbeat to collect monitoring data and to ship it directly to the monitoring cluster.
In Elastic Cloud Hosted, Elastic Cloud Enterprise, and Elastic Cloud on Kubernetes, Elastic manages the installation and configuration of the monitoring agent for you.
You can collect and ship data directly to your monitoring cluster rather than routing it through your production cluster.
The following diagram illustrates a typical monitoring architecture with separate production and monitoring clusters. This example shows Metricbeat, but you can use Elastic Agent instead.

If you have the appropriate license, you can route data from multiple production clusters to a single monitoring cluster. Learn about the differences between various subscription levels.
In general, the monitoring cluster and the clusters being monitored should be running the same version of the stack. A monitoring cluster cannot monitor production clusters running newer versions of the stack. If necessary, the monitoring cluster can monitor production clusters running the latest release of the previous major version.
Refer to the following topics to learn how to configure stack monitoring:
- Elasticsearch:
- Collecting monitoring data with Elastic Agent (recommended): Uses a single agent to gather logs and metrics. Can be managed from a central location in Fleet.
- Collecting monitoring data with Metricbeat: Uses a lightweight Beats shipper to gather metrics. May be preferred if you have an existing investment in Beats or are not yet ready to use Elastic Agent.
- Collecting log data with Filebeat: Uses a lightweight Beats shipper to gather logs.
- Legacy collection methods: Uses internal exporters to gather metrics. Not recommended. If you have previously configured legacy collection methods, you should migrate to using Elastic Agent or Metricbeat.
- Kibana:
- Collect monitoring data with Elastic Agent (recommended): Uses a single agent to gather logs and metrics. Can be managed from a central location in Fleet.
- Collect monitoring data with Metricbeat: Uses a lightweight Beats shipper to gather metrics. May be preferred if you have an existing investment in Beats or are not yet ready to use Elastic Agent.
- Legacy collection methods: Uses internal exporters to gather metrics. Not recommended. If you have previously configured legacy collection methods, you should migrate to using Elastic Agent or Metricbeat.
Most of these methods require that you configure monitoring of Elasticsearch before monitoring other components.
Logstash:
- Monitoring Logstash with Elastic Agent (recommended): Uses a single agent to gather logs and metrics. Can be managed from a central location in Fleet.
- Monitoring Logstash with legacy collection methods: Use Metricbeat or legacy methods to collect monitoring data from Logstash.
Beats:
Elastic Agents:
- Access monitoring data in Kibana: After you collect monitoring data for one or more products in the Elastic Stack, configure Kibana to retrieve that information and display it in on the Stack Monitoring page.
- Visualizing monitoring data: View health and performance data for Elastic Stack components in real time, as well as analyze past performance.
- Stack monitoring alerts: Configure alerts that trigger based on stack monitoring metrics.
- Configuring monitoring data streams and indices: Adjust the data streams and indices used by stack monitoring.