Indices view in AutoOps
The Indices view provides detailed statistics for each Elasticsearch index in your deployment, allowing you to visualize index performance and trends to detect anomalies and optimize search efficiency.
Information about each index is organized into a clear table with columns for the index's name, primary and total shards, indexing and search rate per second, and more. You can expand each index entry to dive deeper into real-time metrics.
Use the Deployment or Cluster dropdown at the top of the screen to select which deployment or cluster you want to view, and use the date and time picker to select a time period for the data shown.
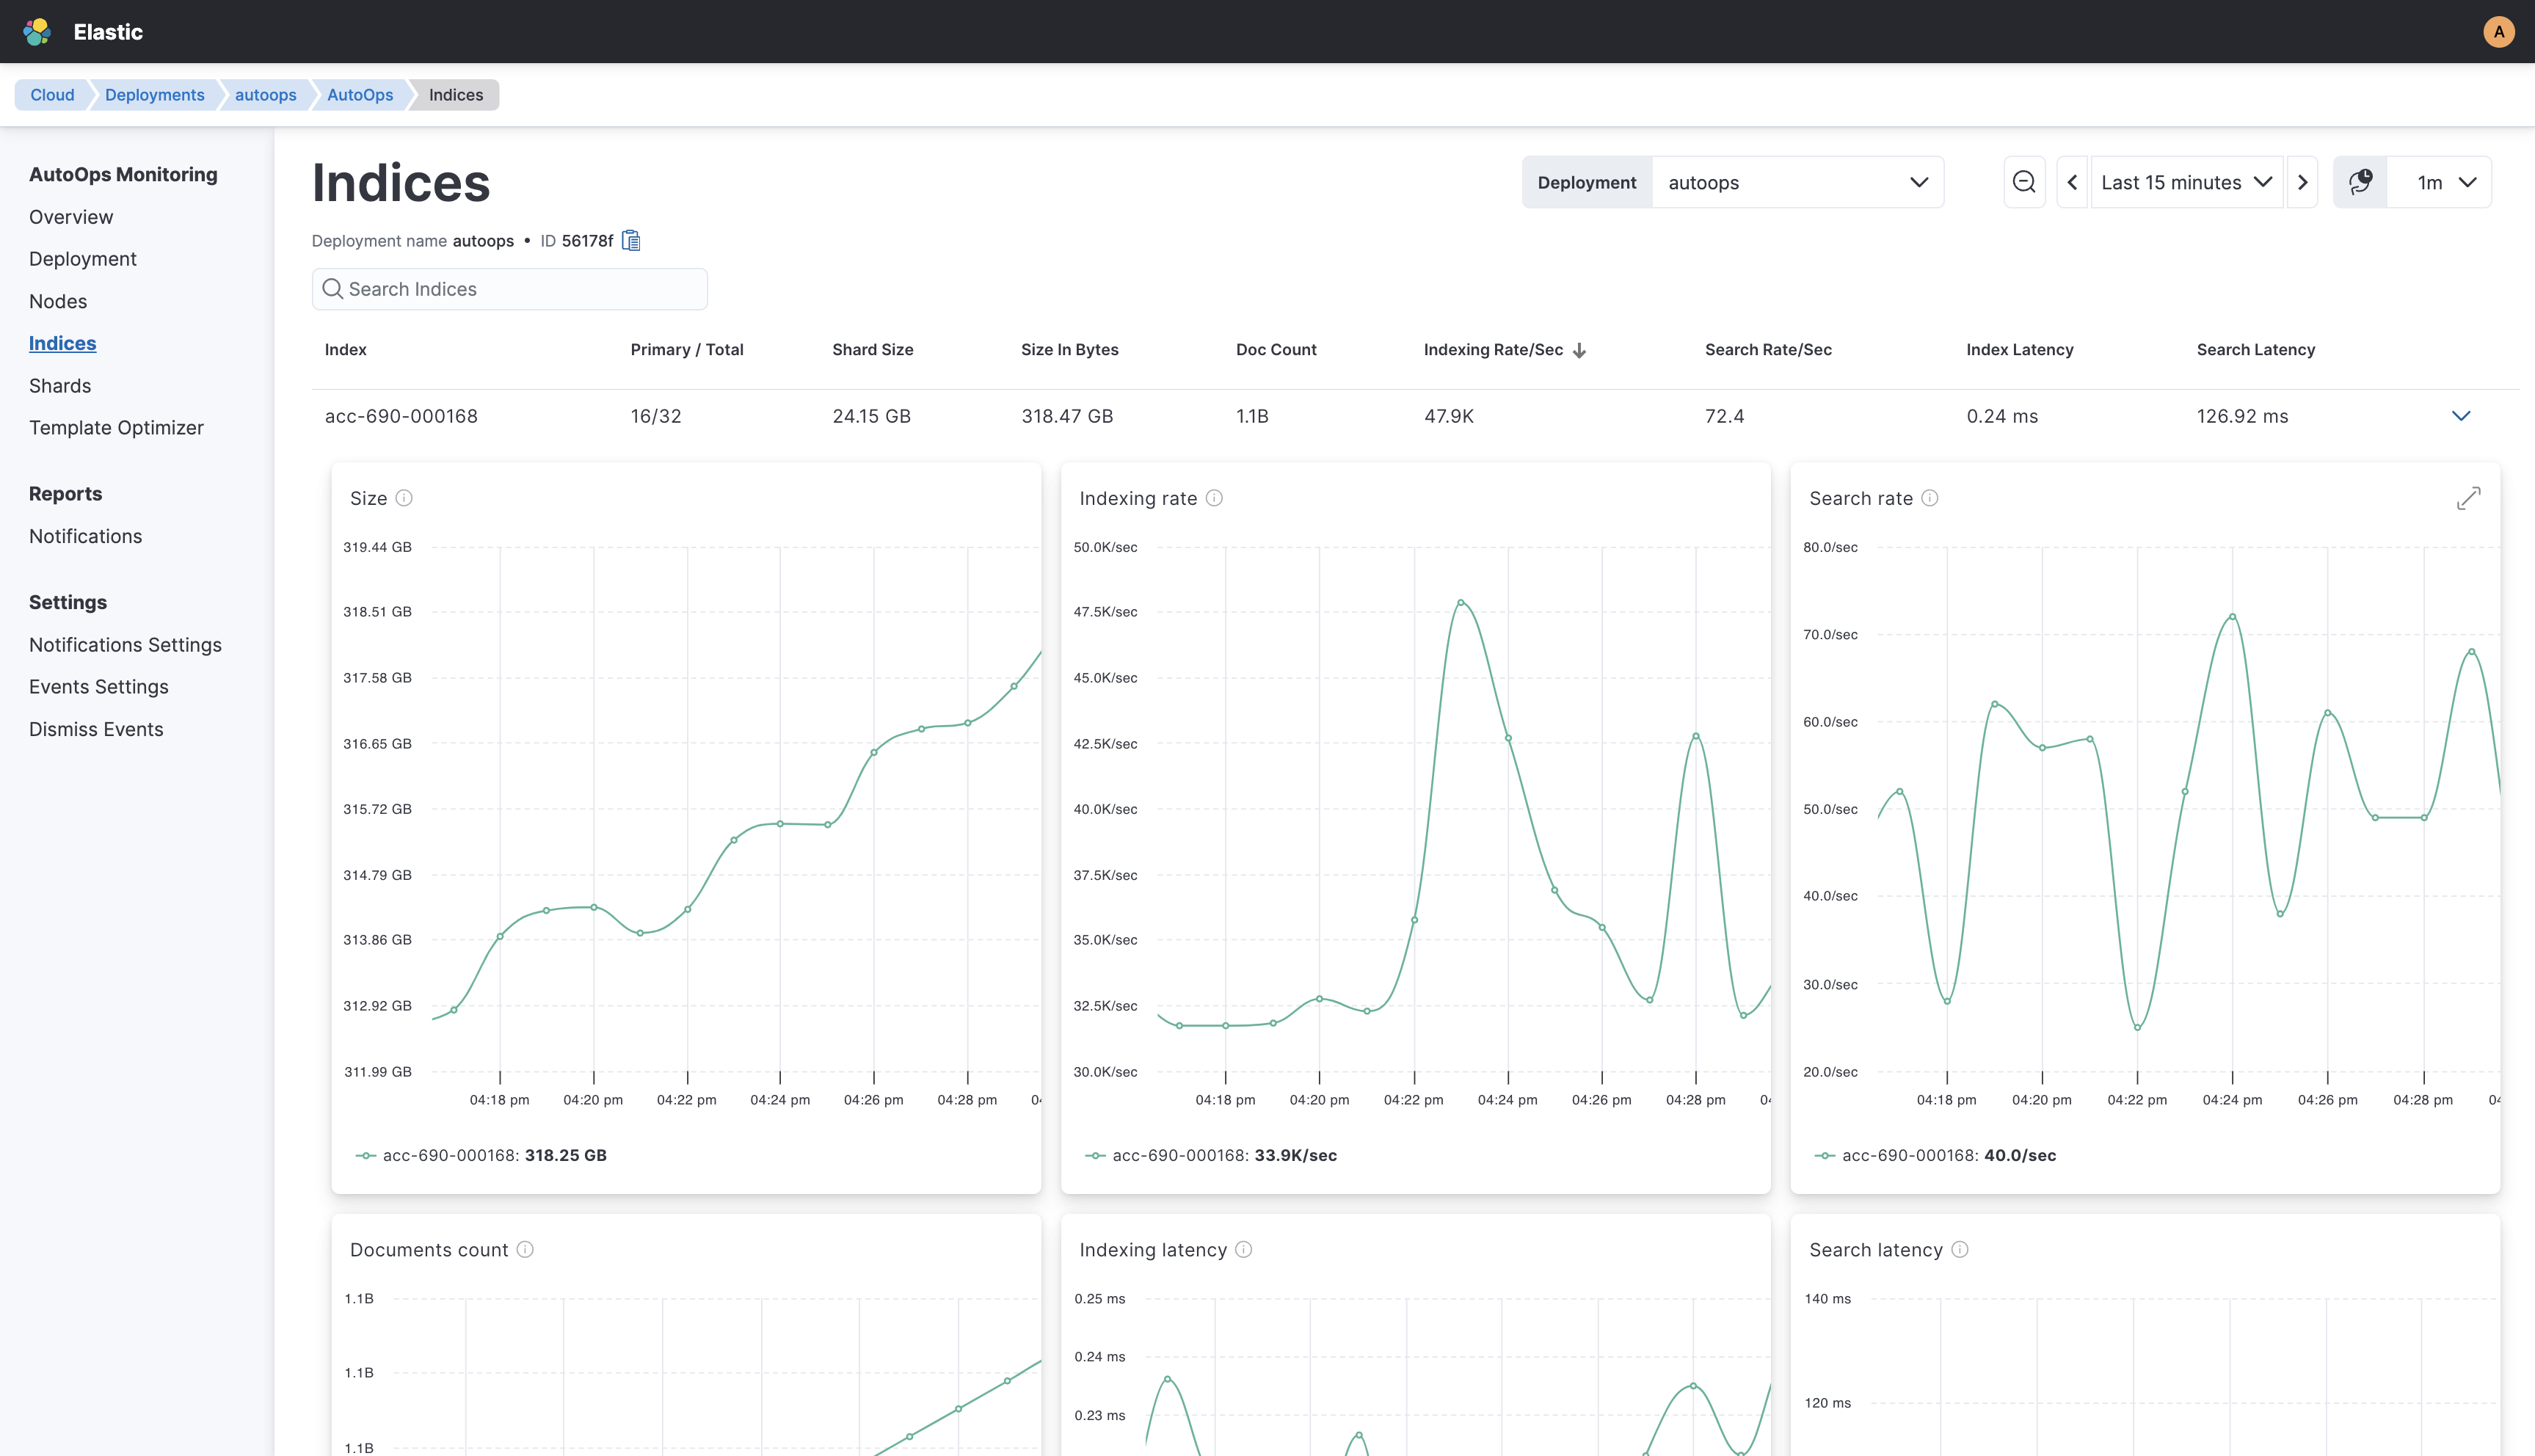
To get to the Indices view, go to AutoOps in your deployment or cluster and select Indices from the side navigation.
The following table lists all the metrics available in the Indices view, along with a description of what each metric means.
| Metric name | Description |
|---|---|
| Size | Total size of all primary shards of the index |
| Indexing rate | Number of documents being indexed per second on primary shards of the index |
| Search rate | Number of search requests being executed per second on all shards of the index |
| Document count | Total number of non-deleted documents in all primary shards of the index, including nested documents |
| Indexing latency | Average latency for indexing documents, which is the time it takes to index documents divided by the number that were indexed in primary shards of the index |
| Search latency | Average latency for searching, which is the time it takes to execute searches divided by the number of searches submitted to all shards of the index |
| Errors | Number of failed indexing operations for the index |
| Merge rate | Number of merge operations being executed per second on all primary shards of the index |
| Merge latency | Average latency for merging, which is the time it takes to execute merges divided by the number of merge operations submitted to all primary shards of the index |