What is Elastic Observability?
Observability provides granular insights and context into the behavior of applications running in your environments. It’s an important part of any system that you build and want to monitor. Being able to detect and fix root cause events quickly within an observable system is a minimum requirement for any analyst.
Elastic Observability provides a single stack to unify your logs, infrastructure metrics, application traces, user experience data, synthetics, and universal profiling. Ingest your data directly to Elasticsearch, where you can further process and enhance the data, before visualizing it and adding alerts in Kibana.

Analyze log data from your hosts, services, Kubernetes, Apache, and many more.
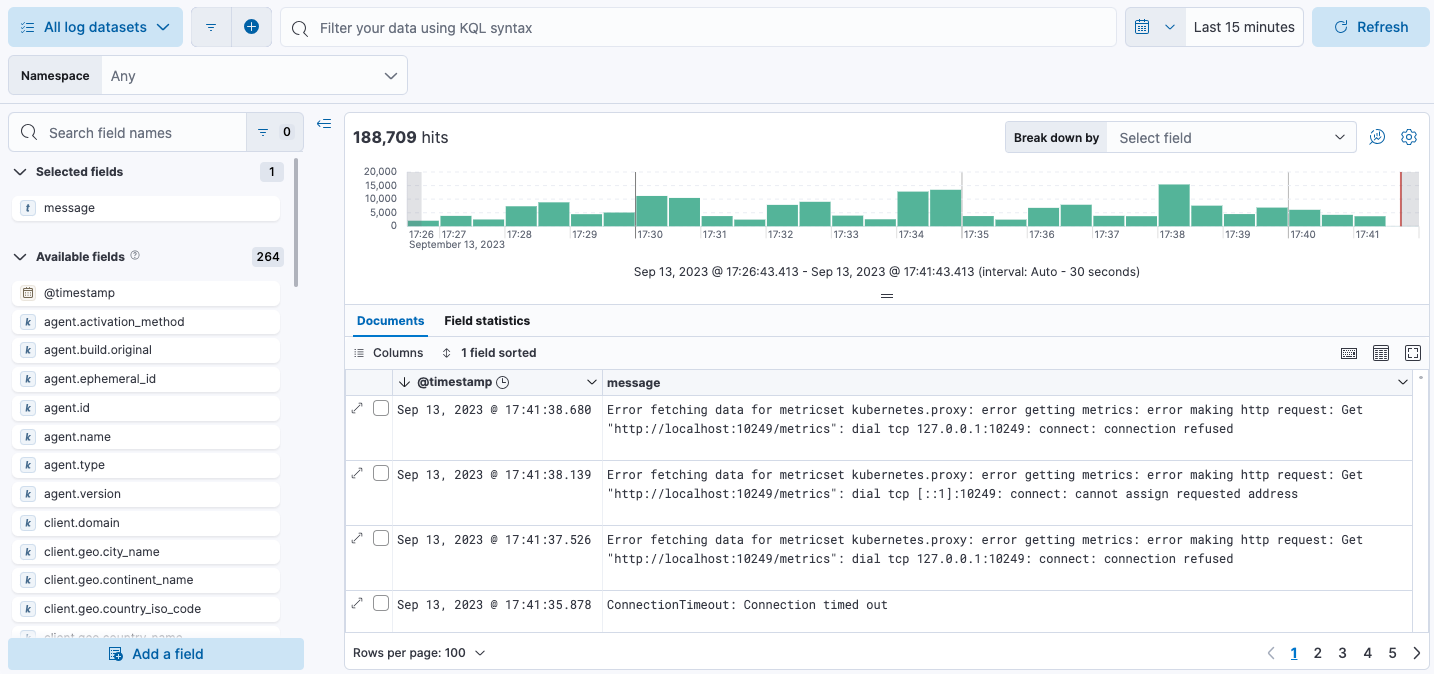
In Discover, you can quickly search and filter your log data, get information about the structure of the fields, and display your findings in a visualization.
Learn more about log monitoring →
Instrument your code and collect performance data and errors at runtime by installing APM agents like Java, Go, .NET, and many more. Then use Observability to monitor your software services and applications in real time:
- Visualize detailed performance information on your services.
- Identify and analyze errors.
- Monitor host-level and APM agent-specific metrics like JVM and Go runtime metrics.
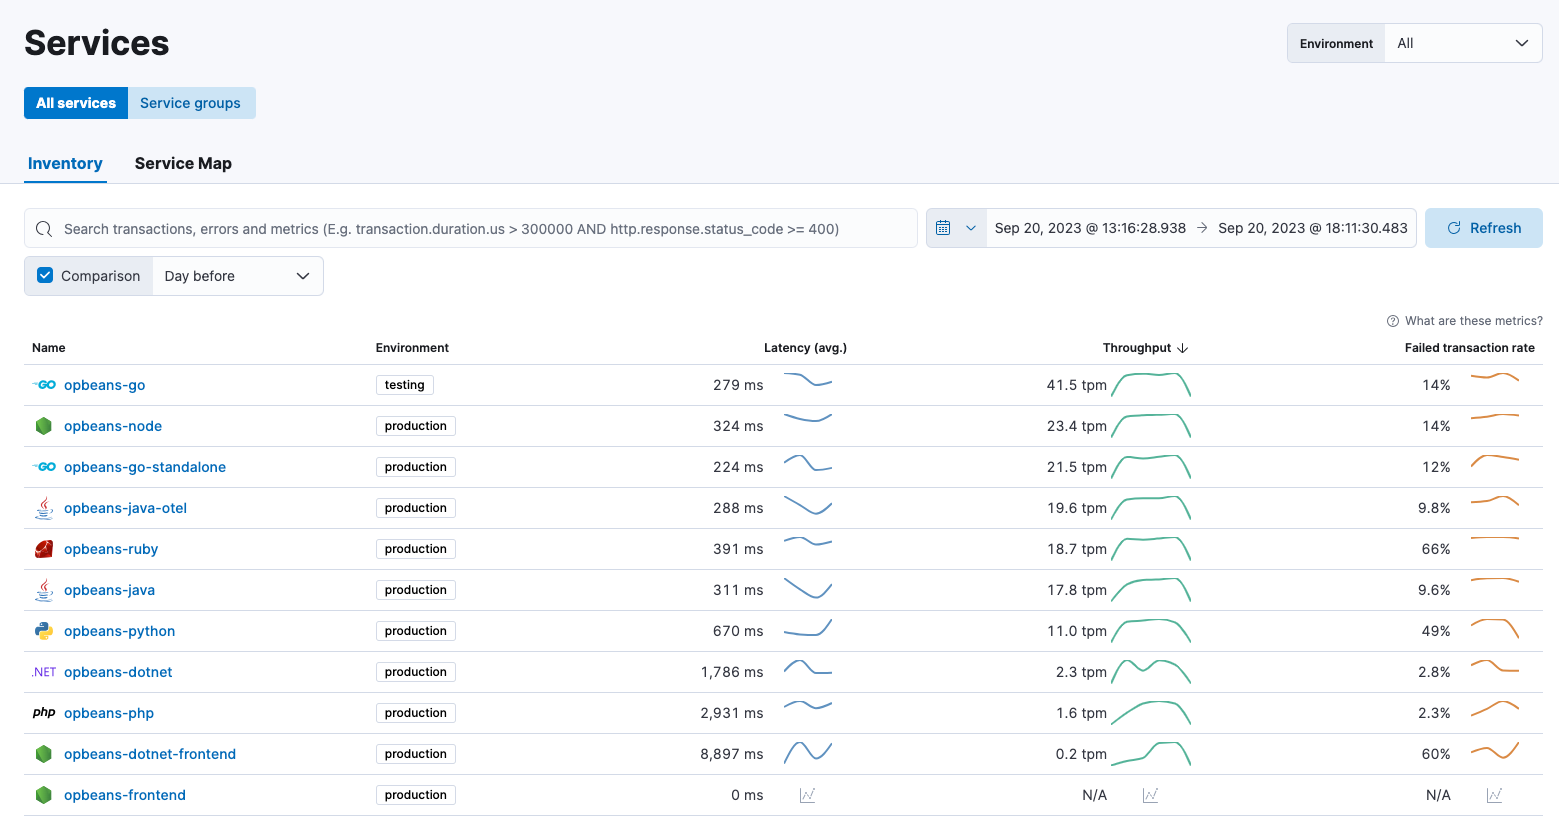
The Service inventory provides a quick, high-level overview of the health and general performance of all instrumented services.
Learn more about Application performance monitoring (APM) →
Monitor system and service metrics from your servers, Docker, Kubernetes, Prometheus, and other services and applications.
On the Observability Overview page, the Hosts table shows your top hosts with the most significant resource footprints. These metrics help you evaluate host efficiency and determine if resource consumption is impacting end users.
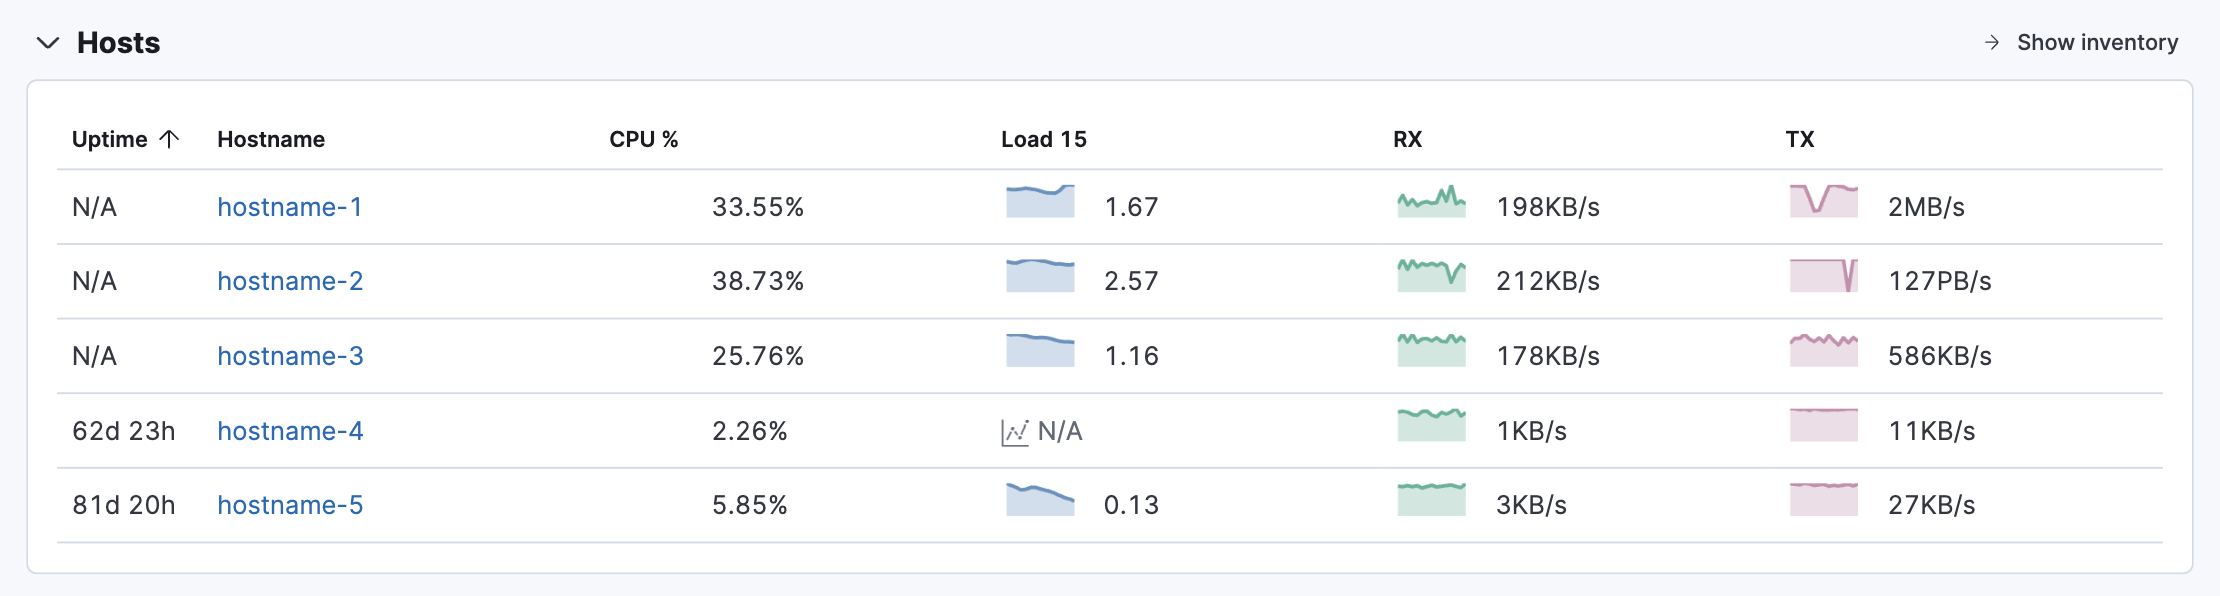
You can then drill down into the Infrastructure app by clicking Show inventory. Here you can monitor and filter your data by hosts, pods, containers,or EC2 instances and create custom groupings such as availability zones or namespaces.
Learn more about infrastructure monitoring →
Quantify and analyze the perceived performance of your web application with User Experience data, powered by the APM RUM agent. Unlike testing environments, User Experience data reflects real-world user experiences.
On the Observability Overview page, the User Experience chart provides a snapshot of core web vitals for the service with the most traffic.
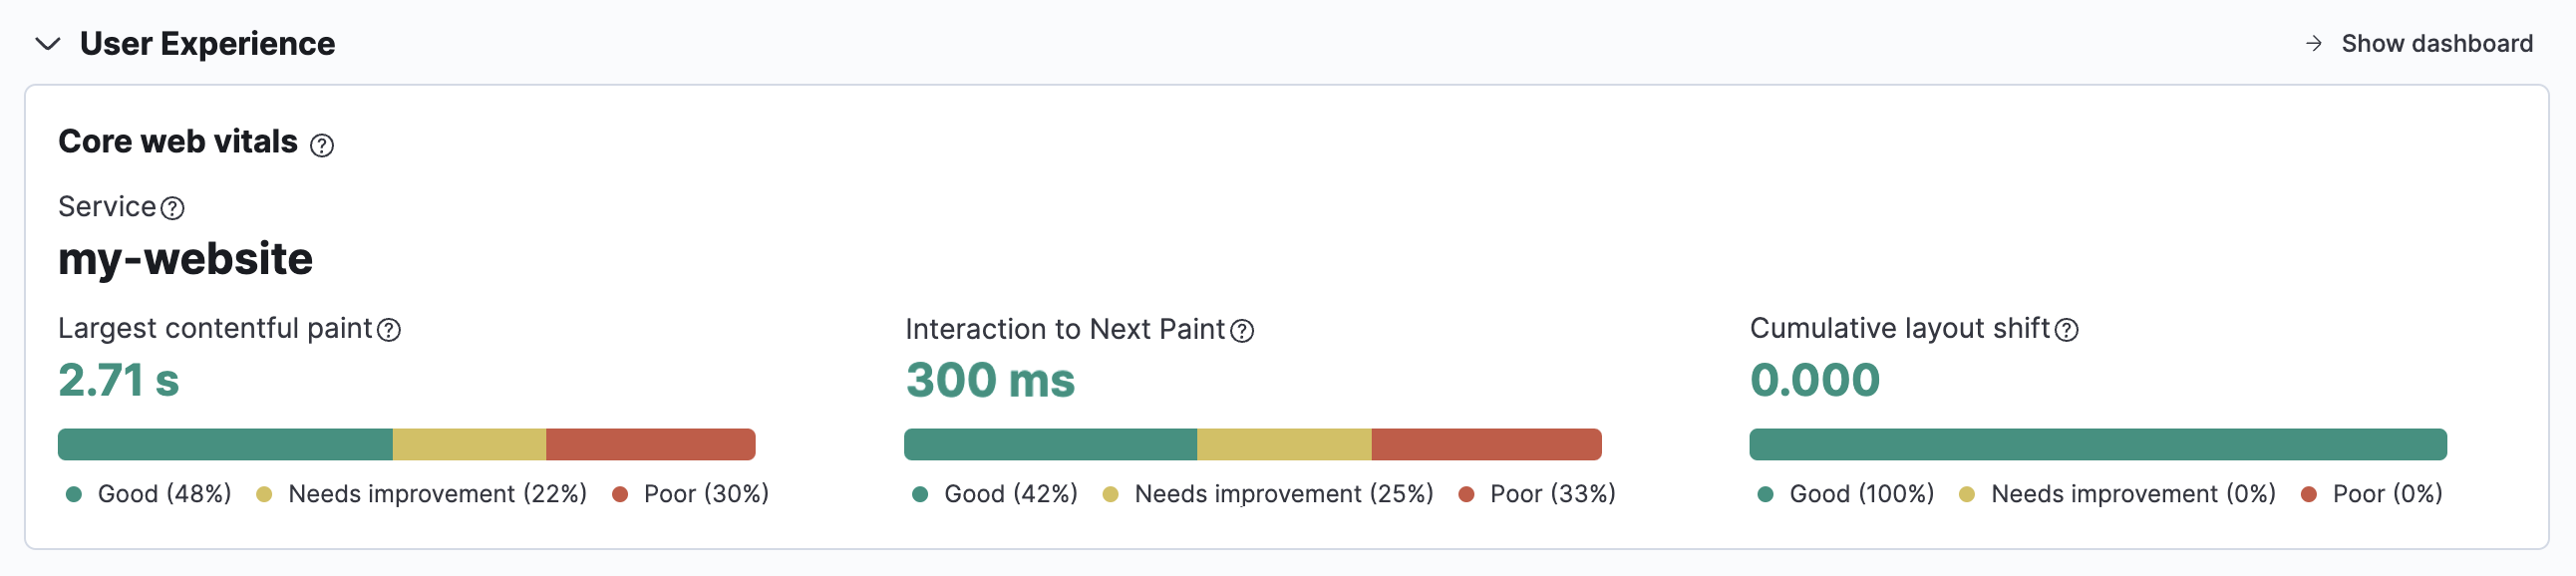
You can then drill down into the User Experience dashboard by clicking Show dashboard too see data by URL, operating system, browser, and location.
Learn more about User Experience →.
Simulate actions and requests that an end user would perform on your site at predefined intervals and in a controlled environment. The end result is rich, consistent, and repeatable data that you can trend and alert on.
Learn more about Synthetic monitoring →.
Build stack traces to get visibility into your system without application source code changes or instrumentation. Use flamegraphs to explore system performance and identify the most expensive lines of code, increase CPU resource efficiency, debug performance regressions, and reduce cloud spend.
Learn more about Universal Profiling →.
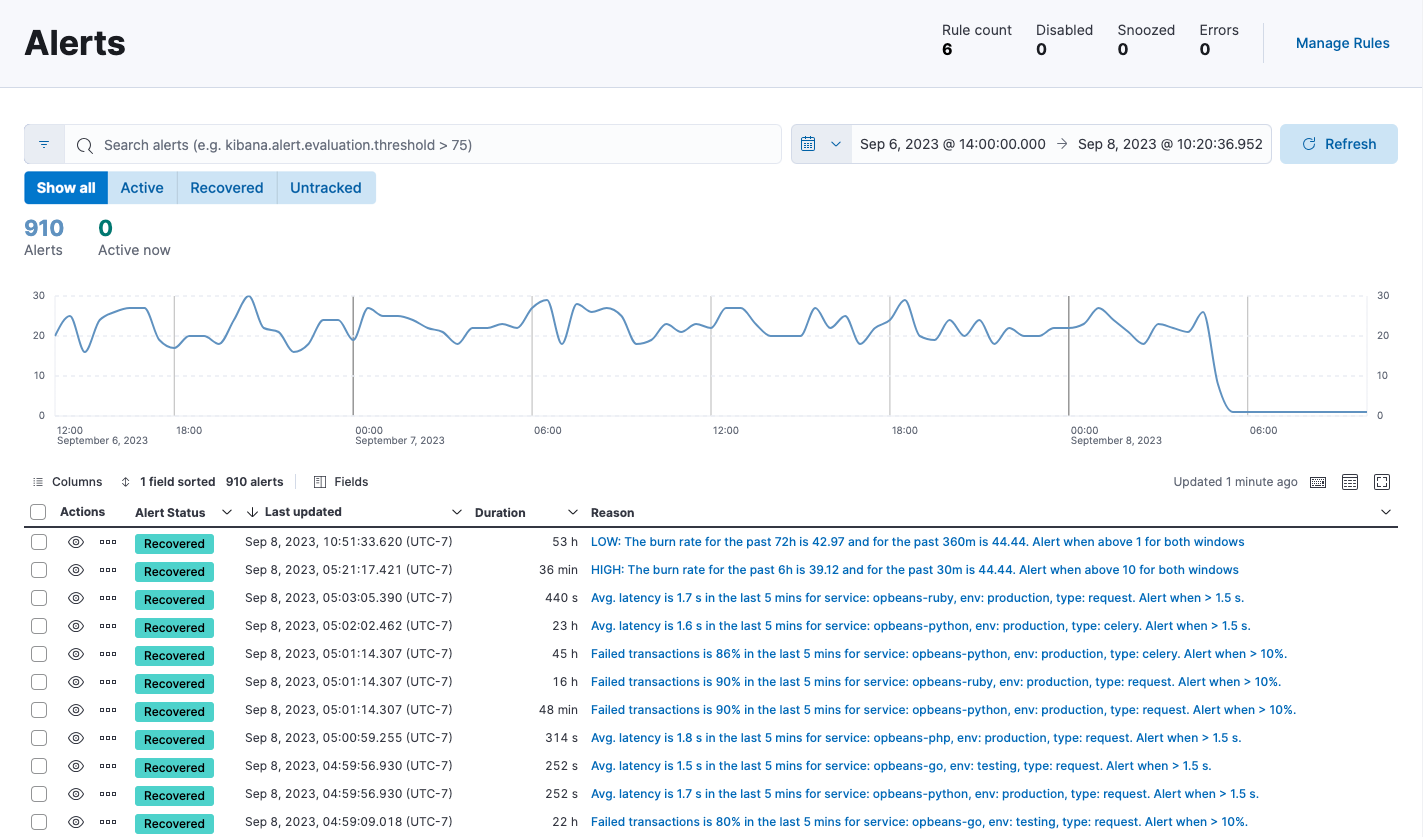
Stay aware of potential issues in your environments with Observability’s alerting and actions feature that integrates with log monitoring and APM. It provides a set of built-in actions and specific threshold rules and enables central management of all rules.
On the Alerts page, the Alerts table provides a snapshot of alerts occurring within the specified time frame. The table includes the alert status, when it was last updated, the reason for the alert, and more.
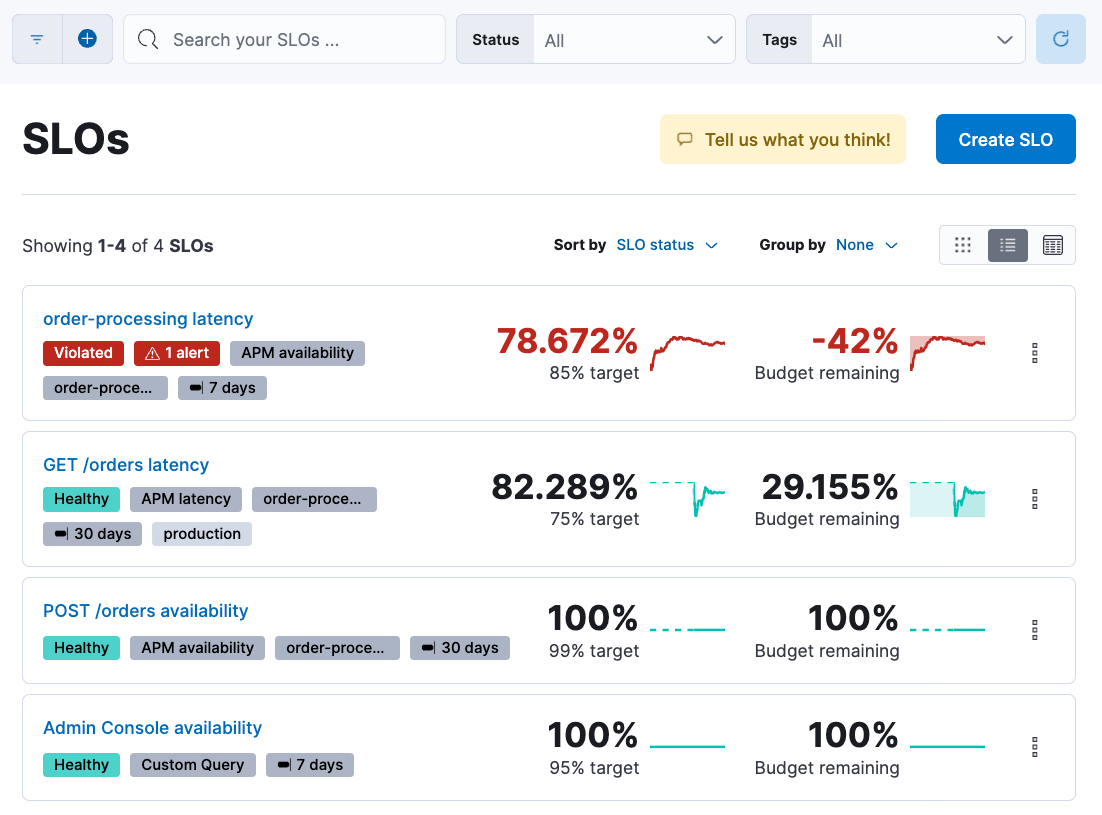
Set clear, measurable targets for your service performance, based on factors like availability, response times, error rates, and other key metrics. Then monitor and track your SLOs in real time, using detailed dashboards and alerts that help you quickly identify and troubleshoot issues.
From the SLO overview list, you can see all of your SLOs and a quick summary of what’s happening in each one:
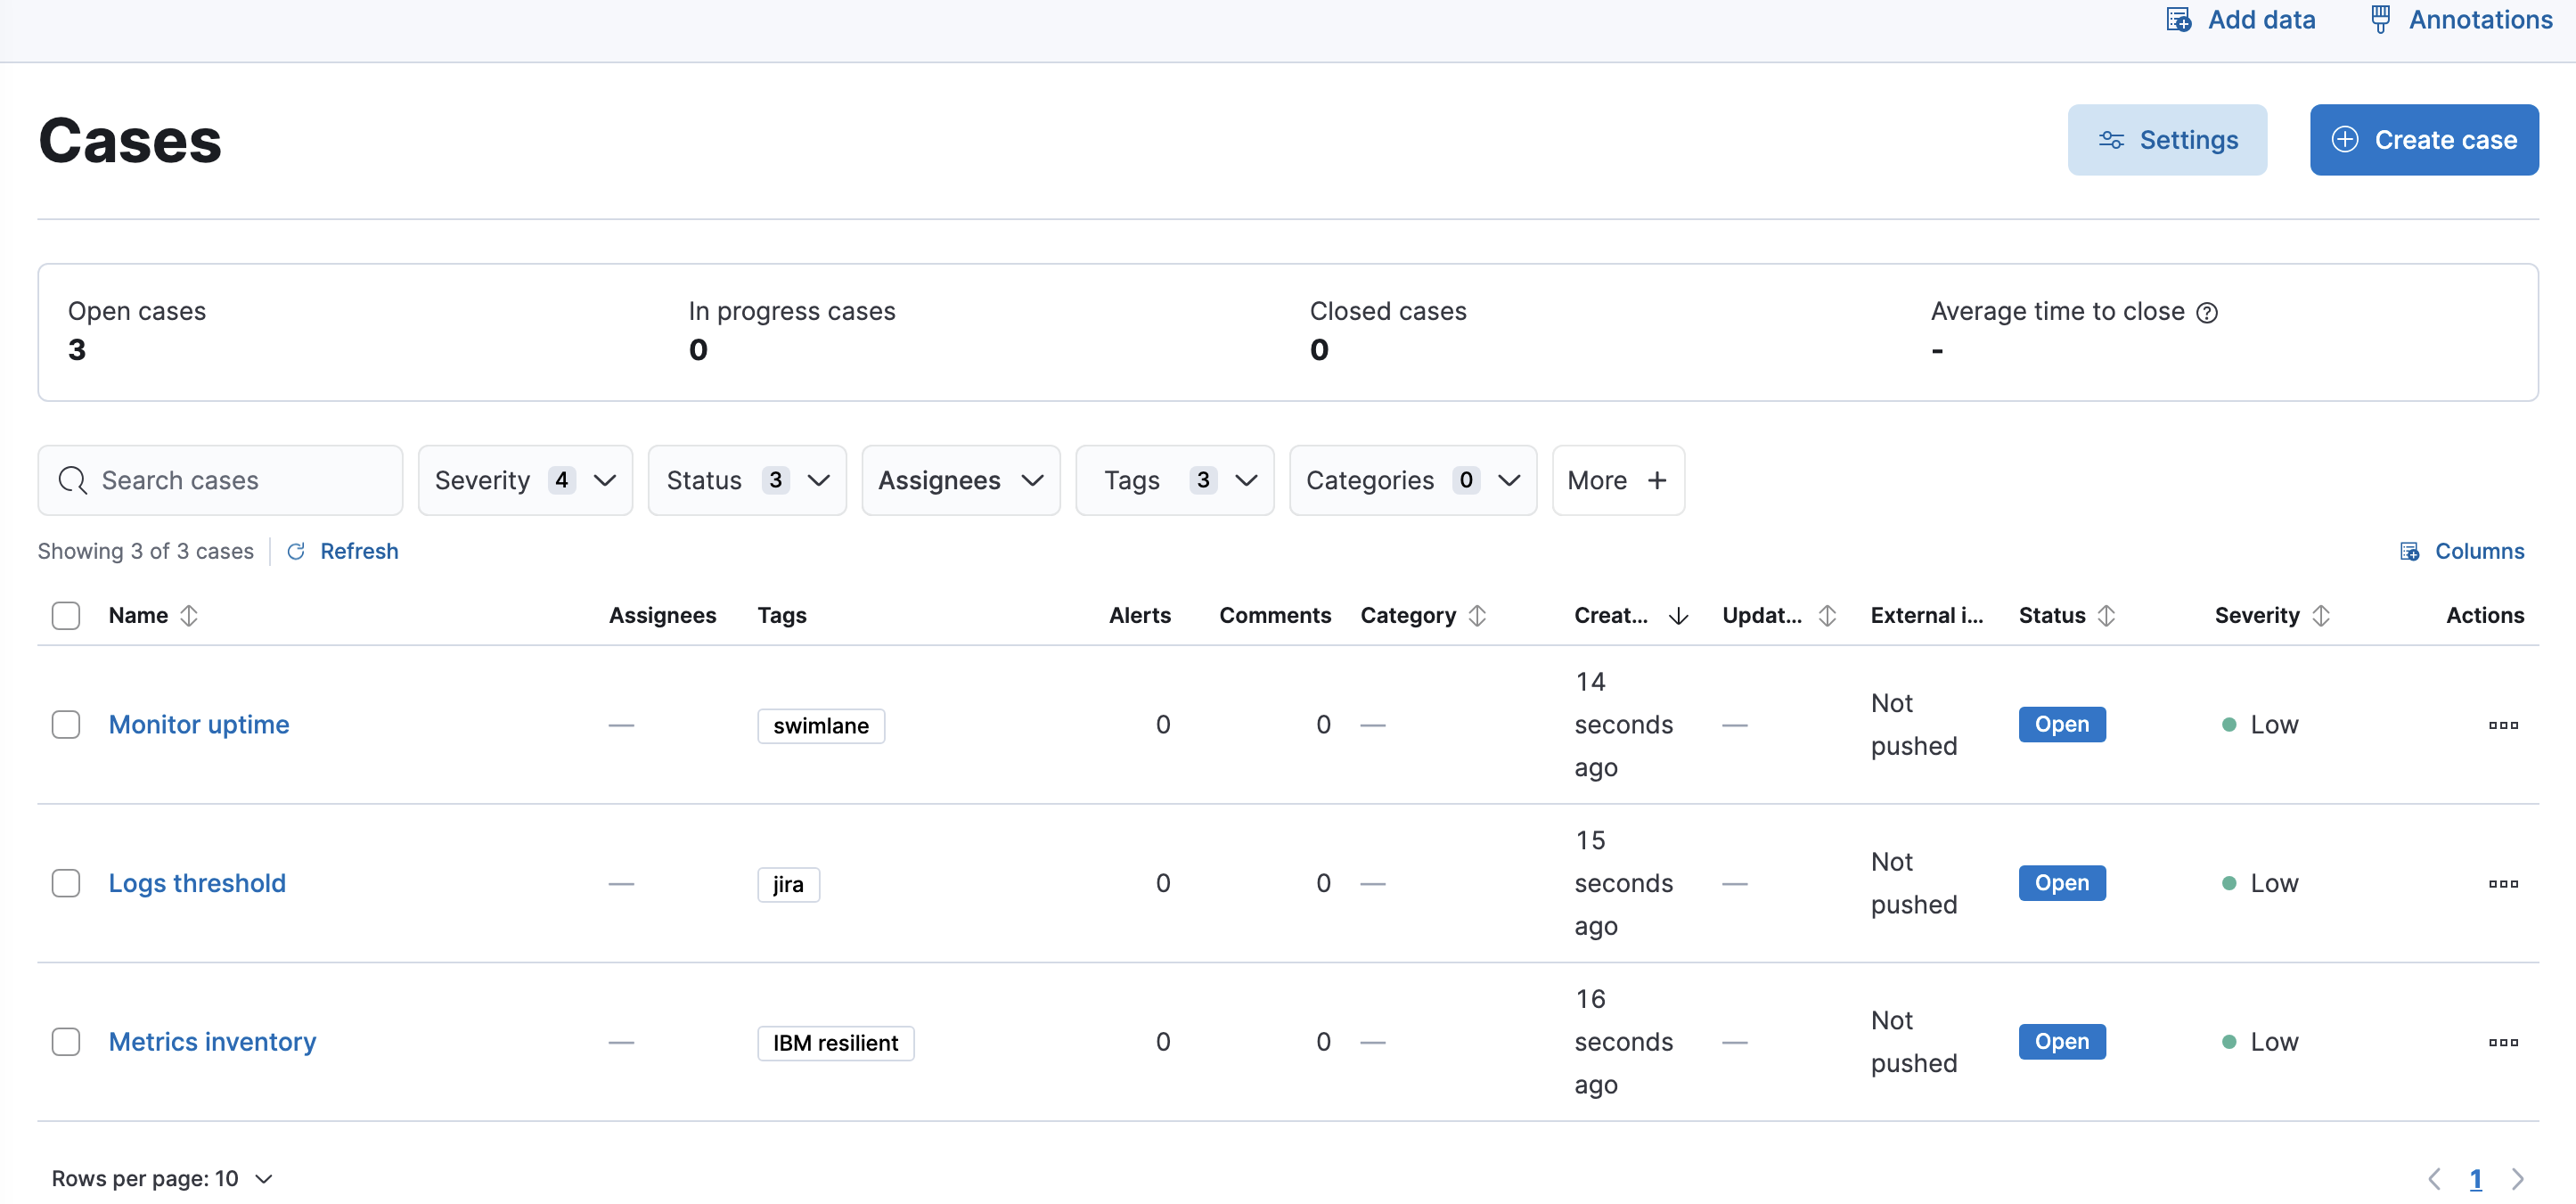
Collect and share information about observability issues by creating cases. Cases allow you to track key investigation details, add assignees and tags to your cases, set their severity and status, and add alerts, comments, and visualizations. You can also send cases to third-party systems, such as ServiceNow and Jira.
Reduce the time and effort required to detect, understand, investigate, and resolve incidents at scale by leveraging predictive analytics and machine learning:
- Detect anomalies by comparing real-time and historical data from different sources to look for unusual, problematic patterns.
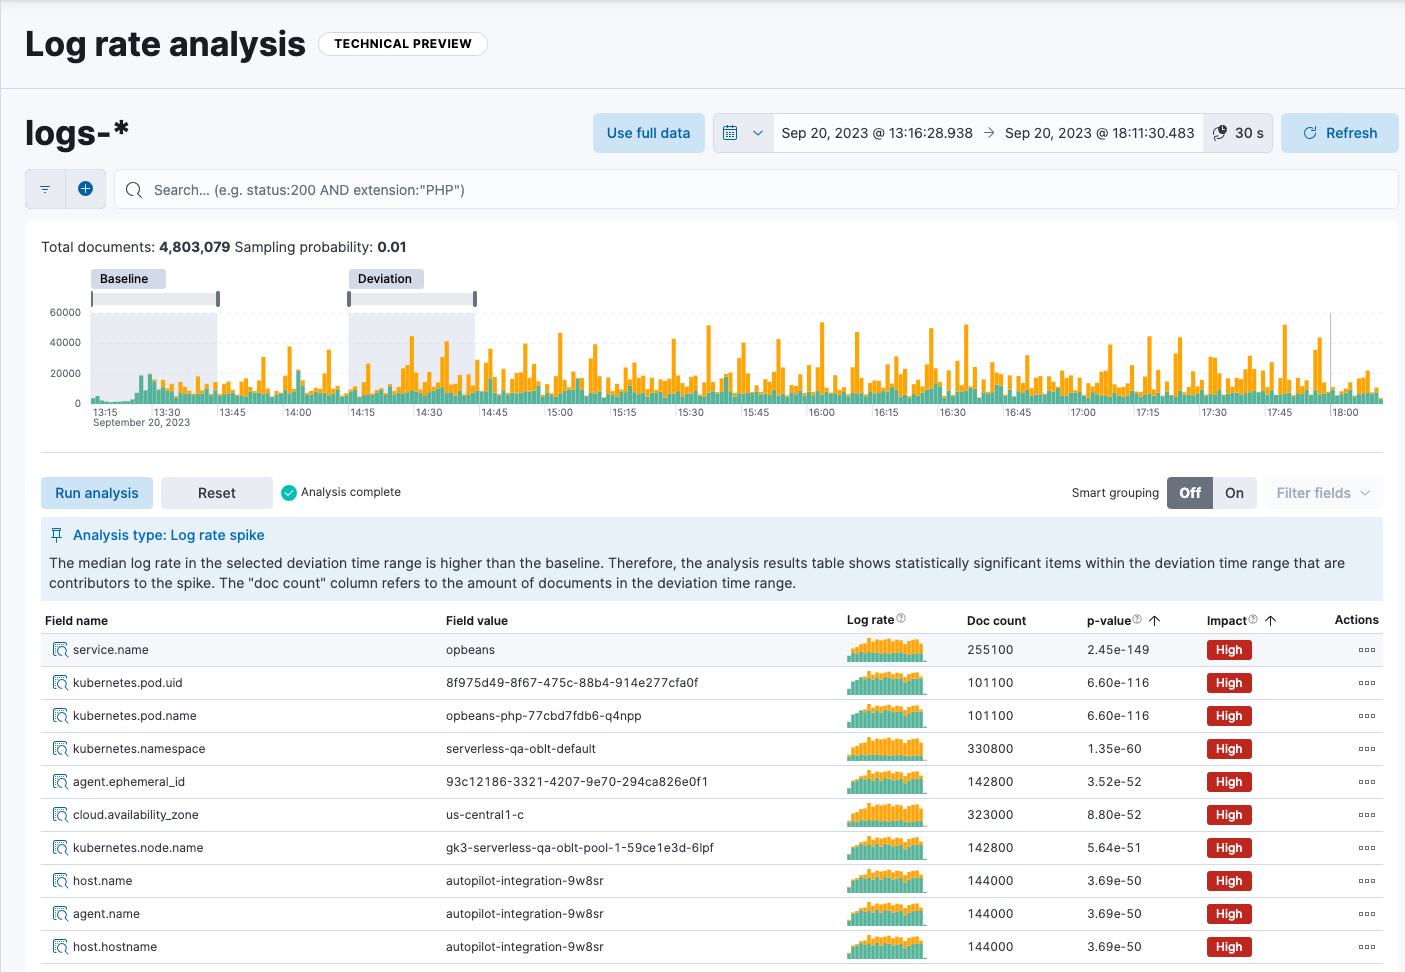
- Find and investigate the causes of unusual spikes or drops in log rates.
- Detect distribution changes, trend changes, and other statistically significant change points in a metric of your time series data.