View and analyze risk score data
The Elastic Security app provides several options to monitor the change in the risk posture of hosts and users from your environment. Use the following places in the Elastic Security app to view and analyze risk score data:
- Entity Analytics dashboard
- Alerts page
- Alert details flyout
- Hosts and Users pages
- Host and user details pages
- Host and user details flyouts
We recommend that you prioritize alert triaging to identify anomalies or abnormal behavior patterns.
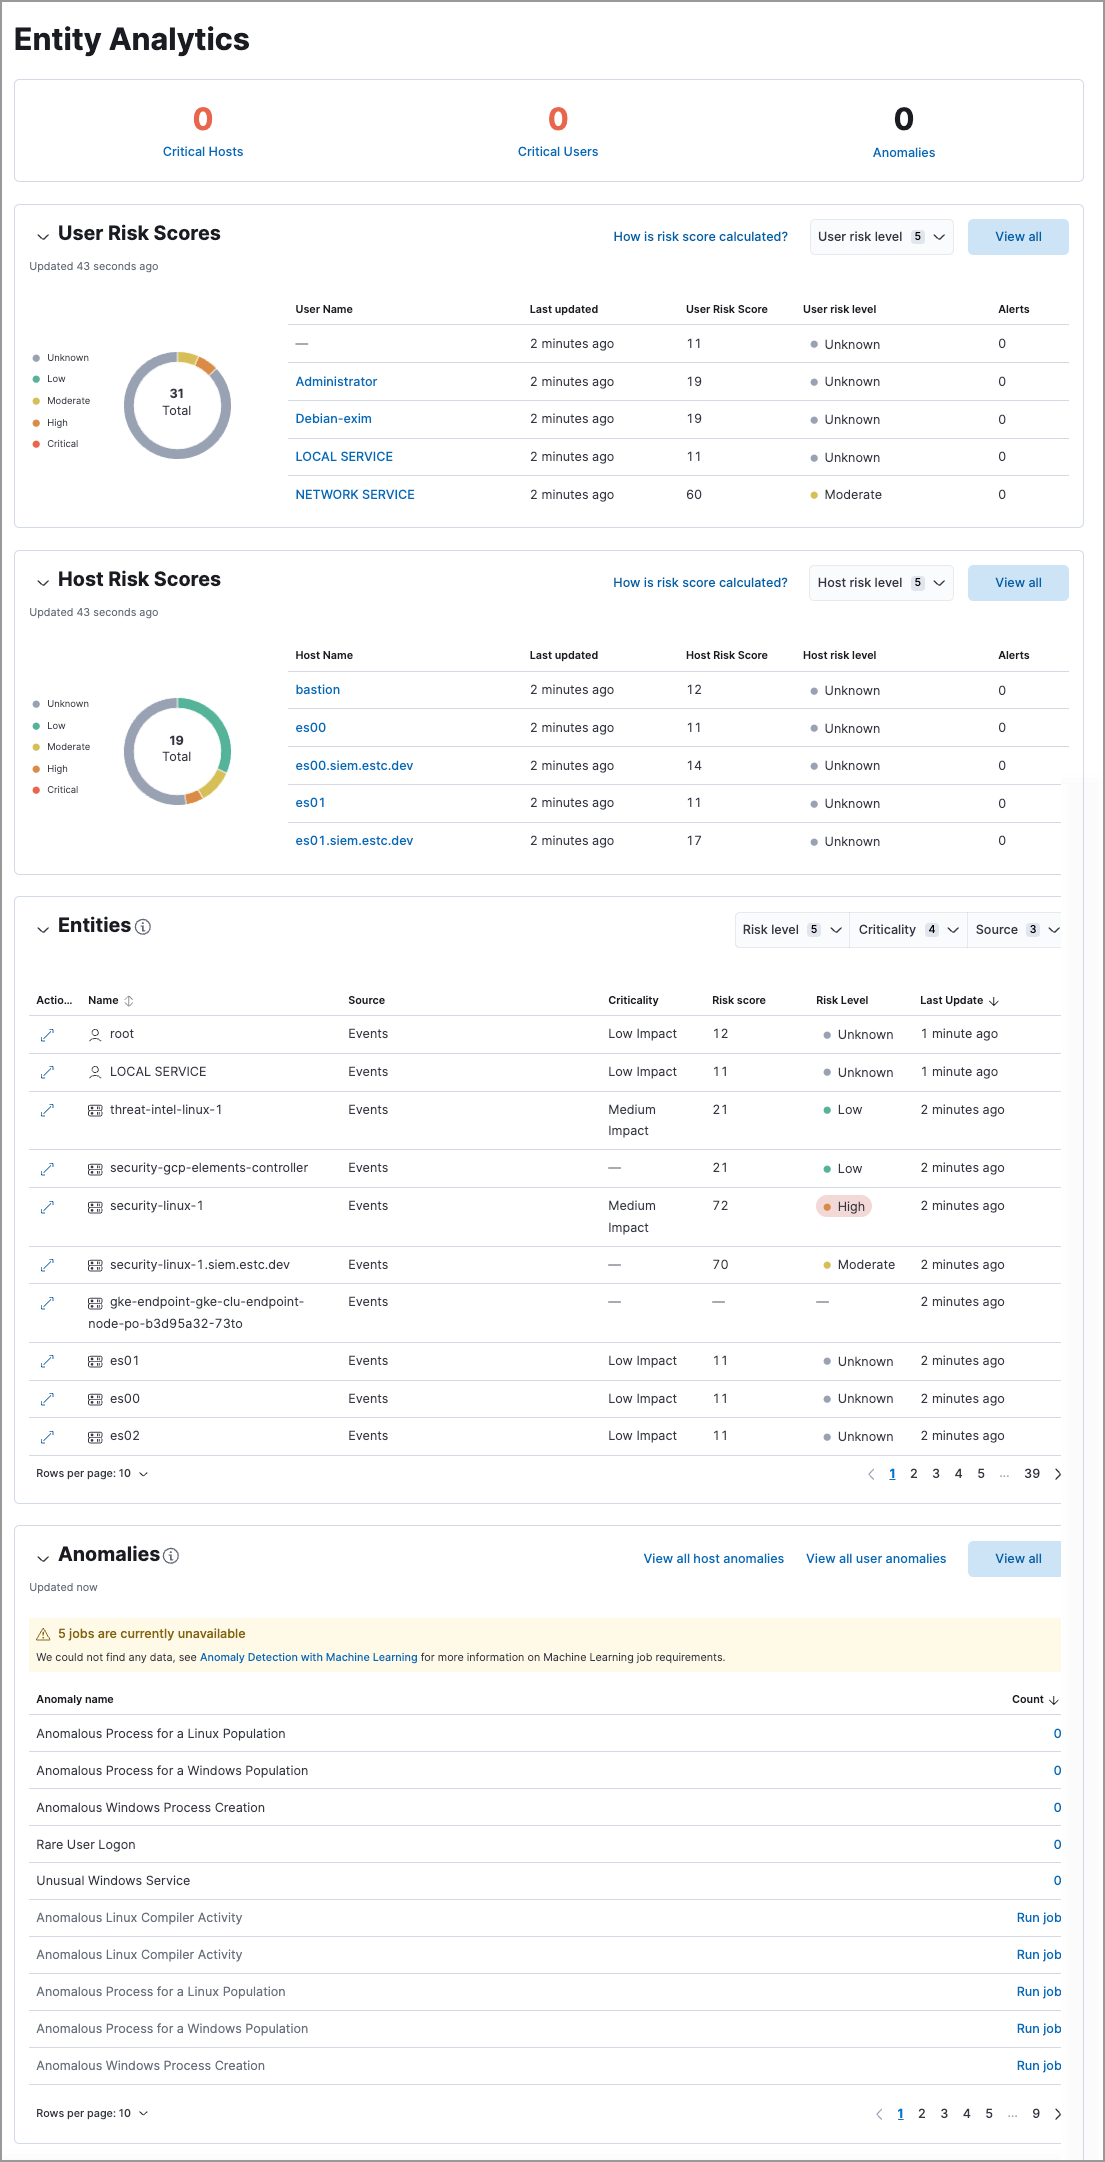
From the Entity Analytics dashboard, you can access entity key performance indicators (KPIs), risk scores, and levels. You can also click the number link in the Alerts column to investigate and analyze the alerts on the Alerts page.
If you have enabled the entity store, the dashboard also displays the Entities section, where you can view all hosts and users along with their risk and asset criticality data.
You can prioritize alert triaging to analyze alerts associated with risky or business-critical entities using the following features in the Elastic Security app.
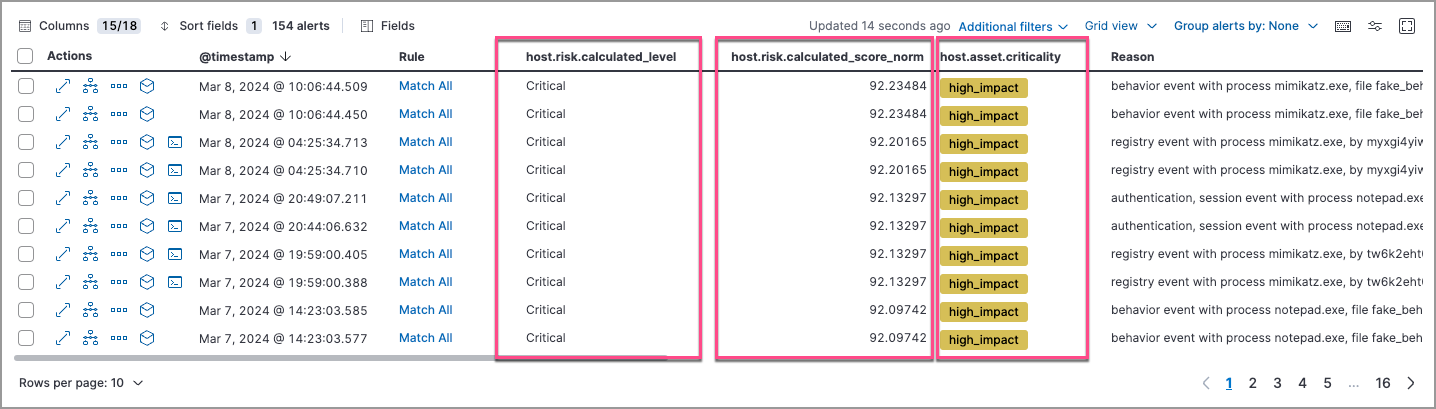
Use the Alerts table to investigate and analyze:
- Host and user risk levels
- Host and user risk scores
- Asset criticality
To display entity risk score and asset criticality data in the Alerts table, select Fields, and add the following:
user.risk.calculated_levelorhost.risk.calculated_leveluser.risk.calculated_score_normorhost.risk.calculated_score_normuser.asset.criticalityorhost.asset.criticality
Learn more about customizing the Alerts table.
To analyze alerts associated with high-risk or business-critical entities, you can filter or group them by entity risk level or asset criticality level.
If you change the entity’s criticality level after an alert is generated, that alert document will include the original criticality level and will not reflect the new criticality level.
Use the drop-down filter controls to filter alerts by entity risk level or asset criticality level. To do this, edit the default controls to filter by:
user.risk.calculated_levelorhost.risk.calculated_levelfor entity risk level: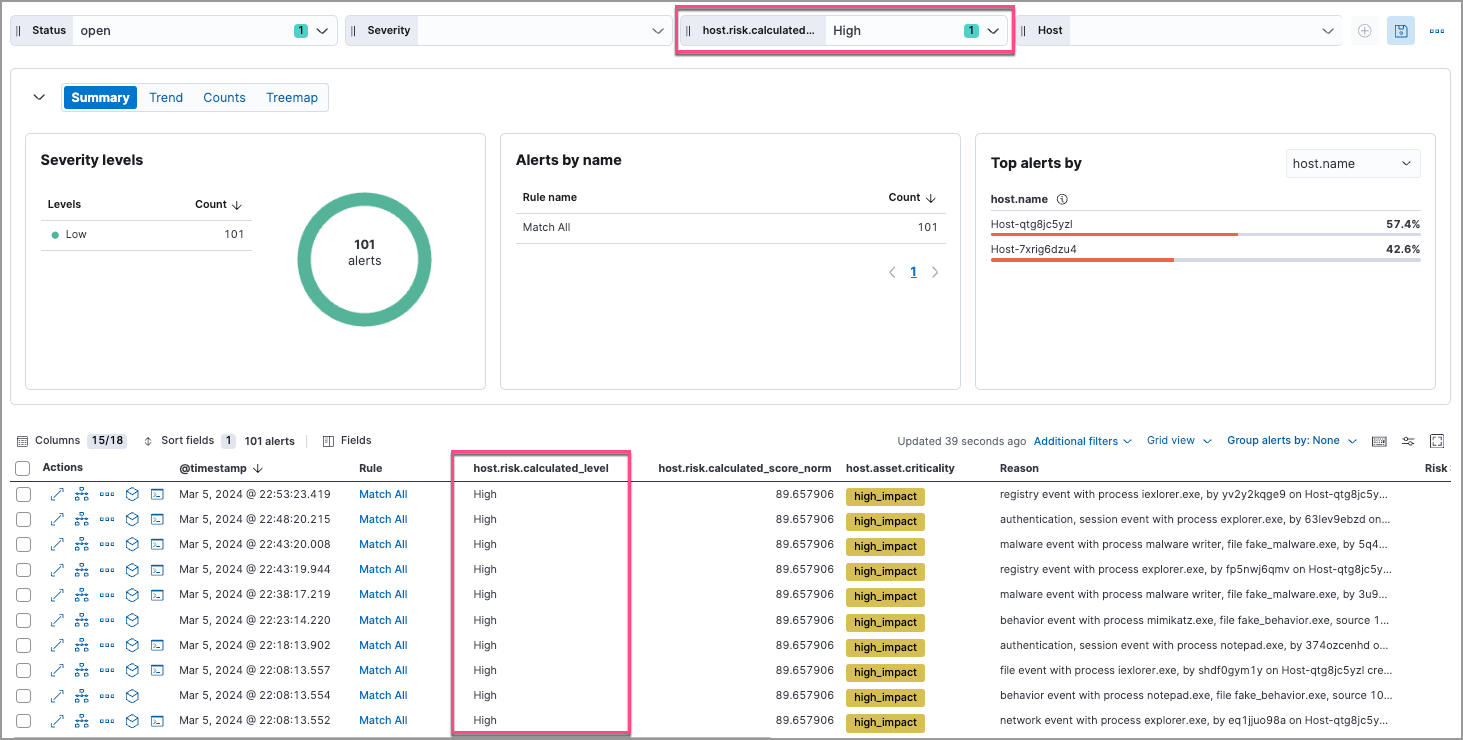
user.asset.criticalityorhost.asset.criticalityfor asset criticality level: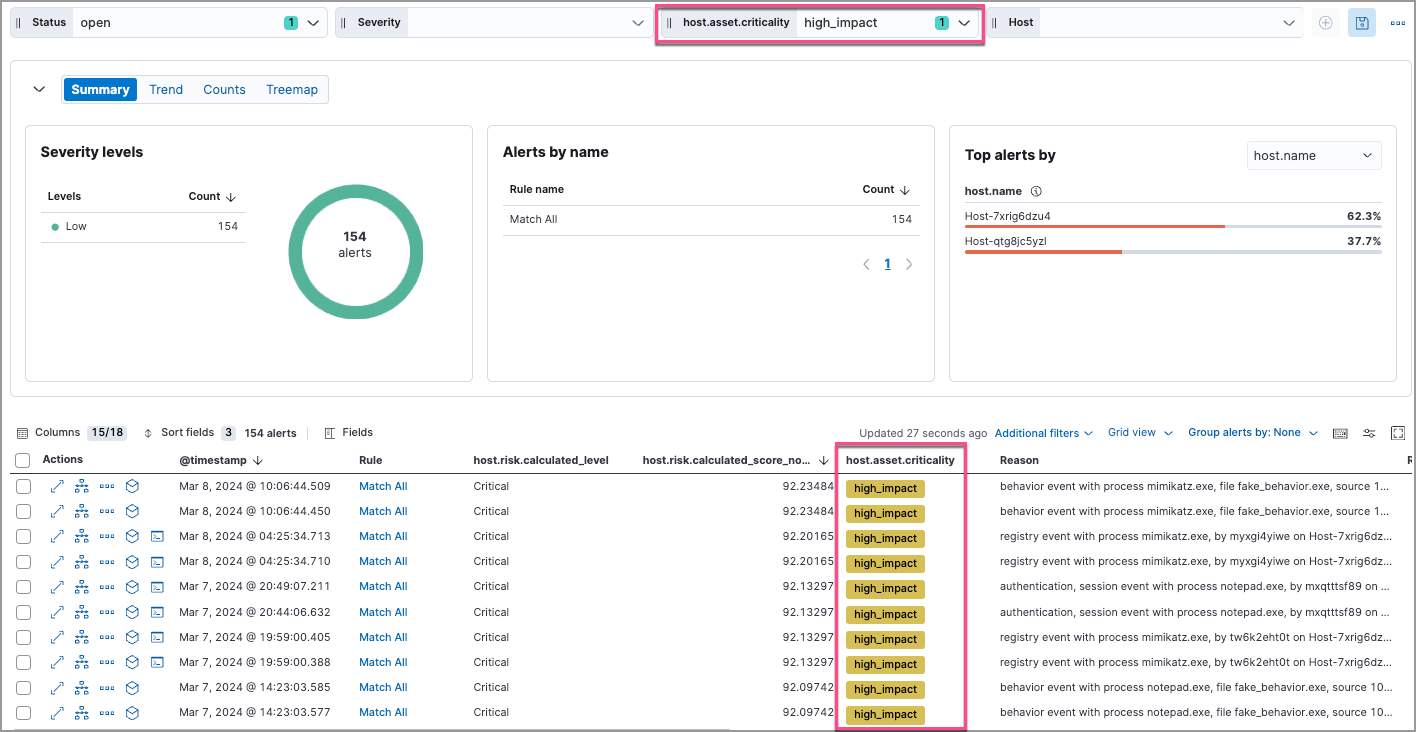
To group alerts by entity risk level or asset criticality level, select Group alerts by, then select Custom field and search for:
host.risk.calculated_leveloruser.risk.calculated_levelfor entity risk level: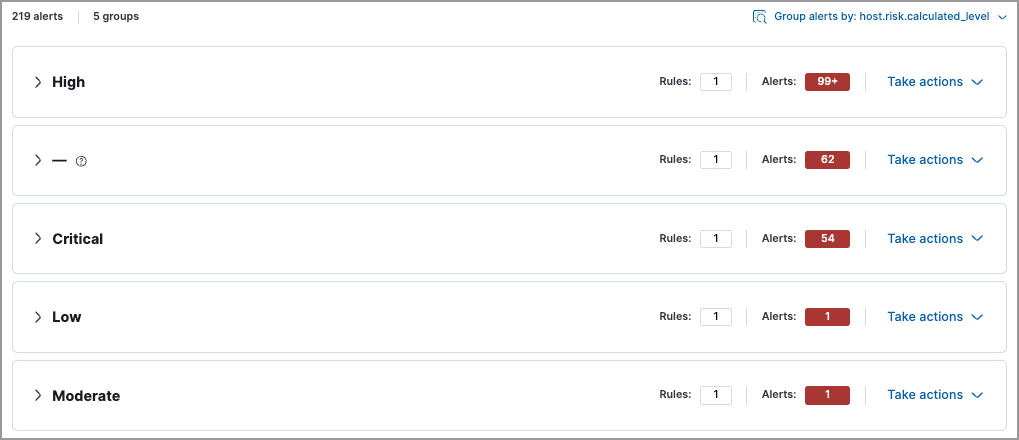
host.asset.criticalityoruser.asset.criticalityfor asset criticality level: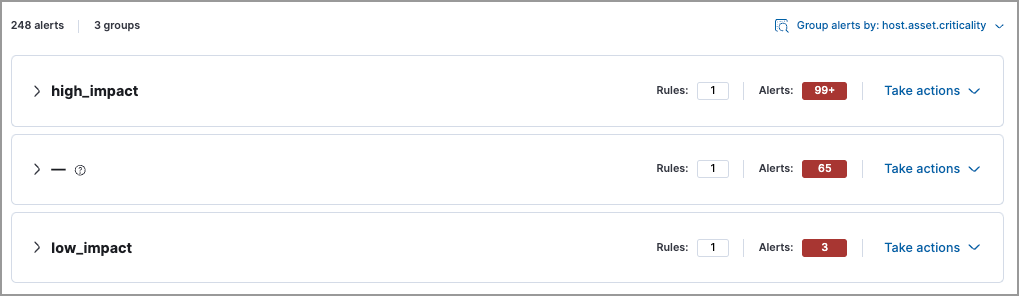
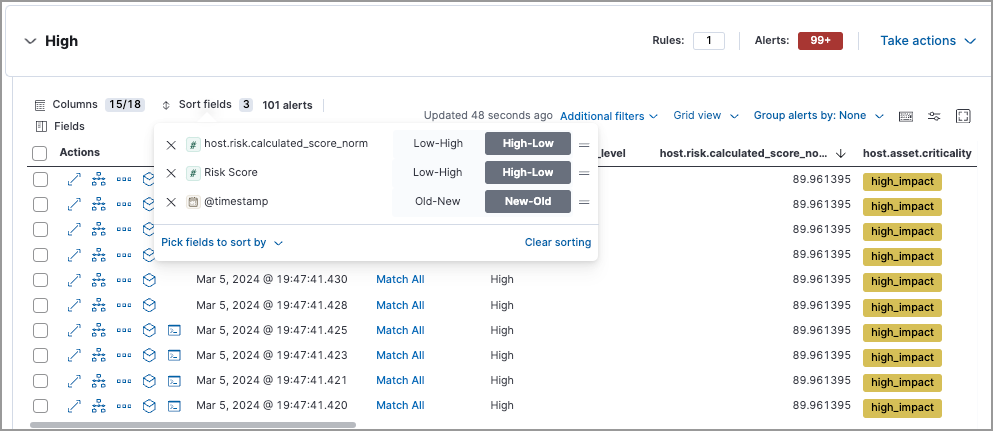
You can further sort the grouped alerts by highest entity risk score:
Expand a risk level group (for example, High) or an asset criticality group (for example, high_impact).
Select Sort fields → Pick fields to sort by.
Select fields in the following order:
host.risk.calculated_score_normoruser.risk.calculated_score_norm: High-LowRisk score: High-Low@timestamp: New-Old
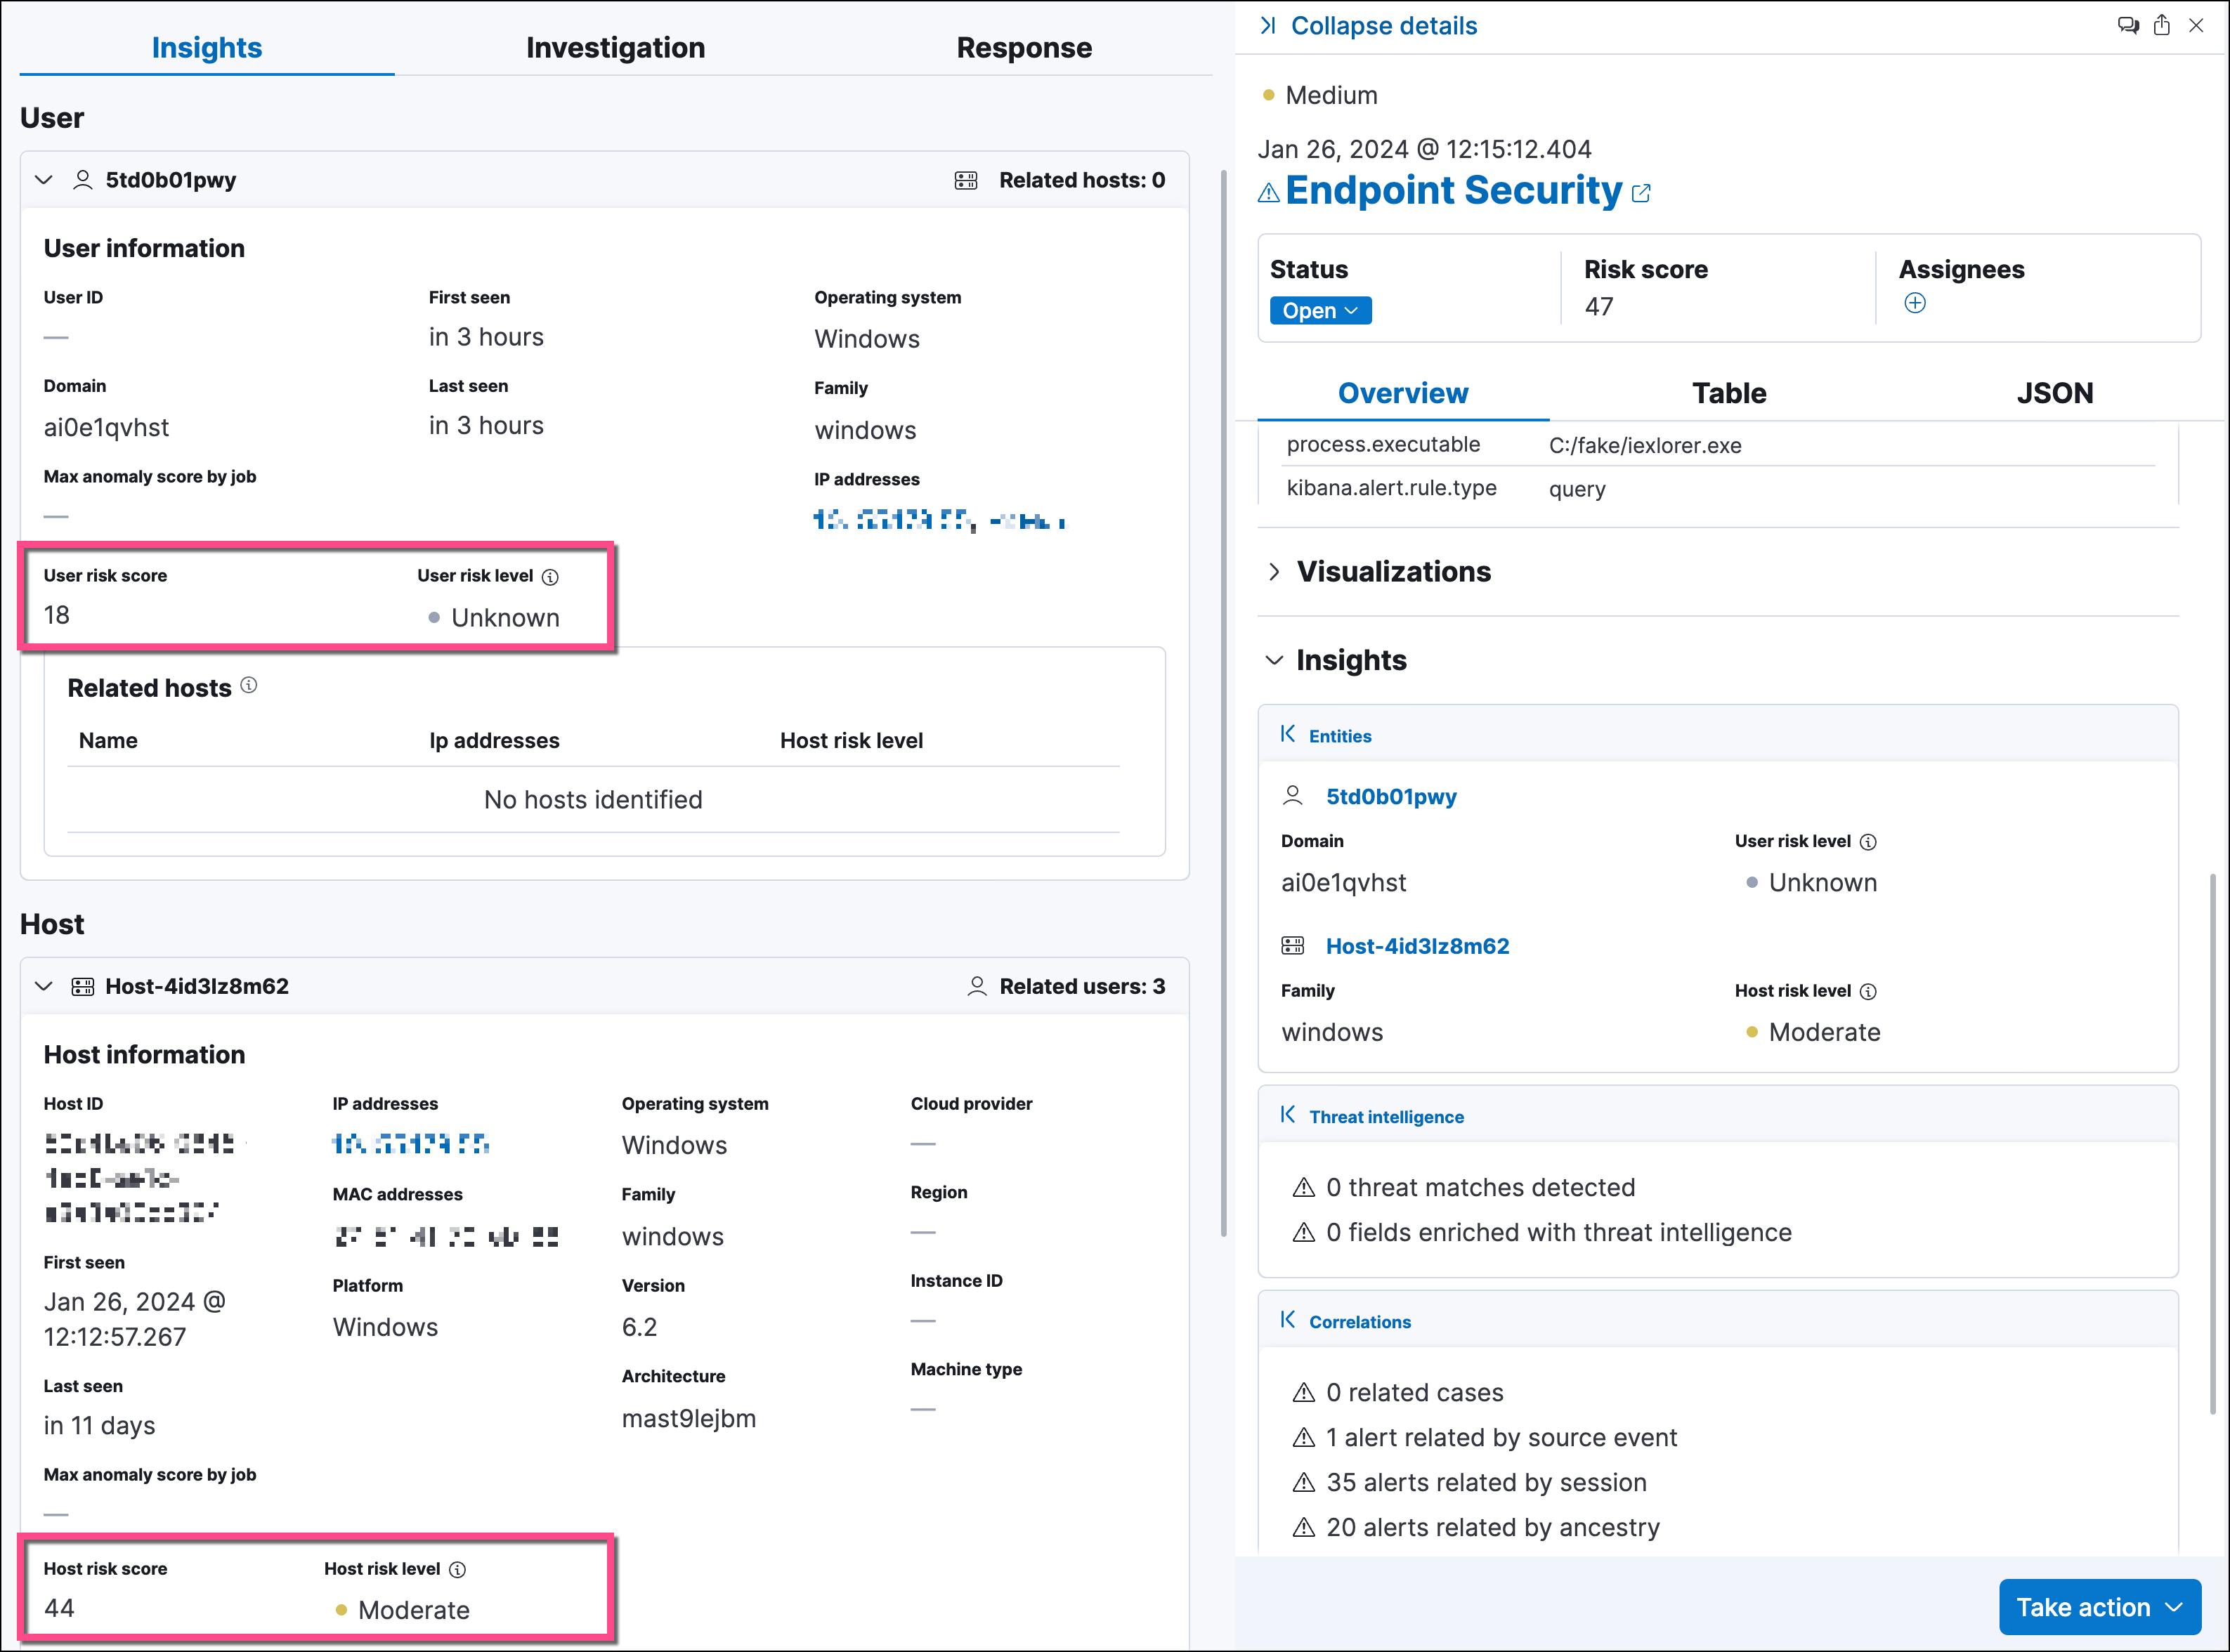
To access risk score data in the alert details flyout, select Insights → Entities on the Overview tab:
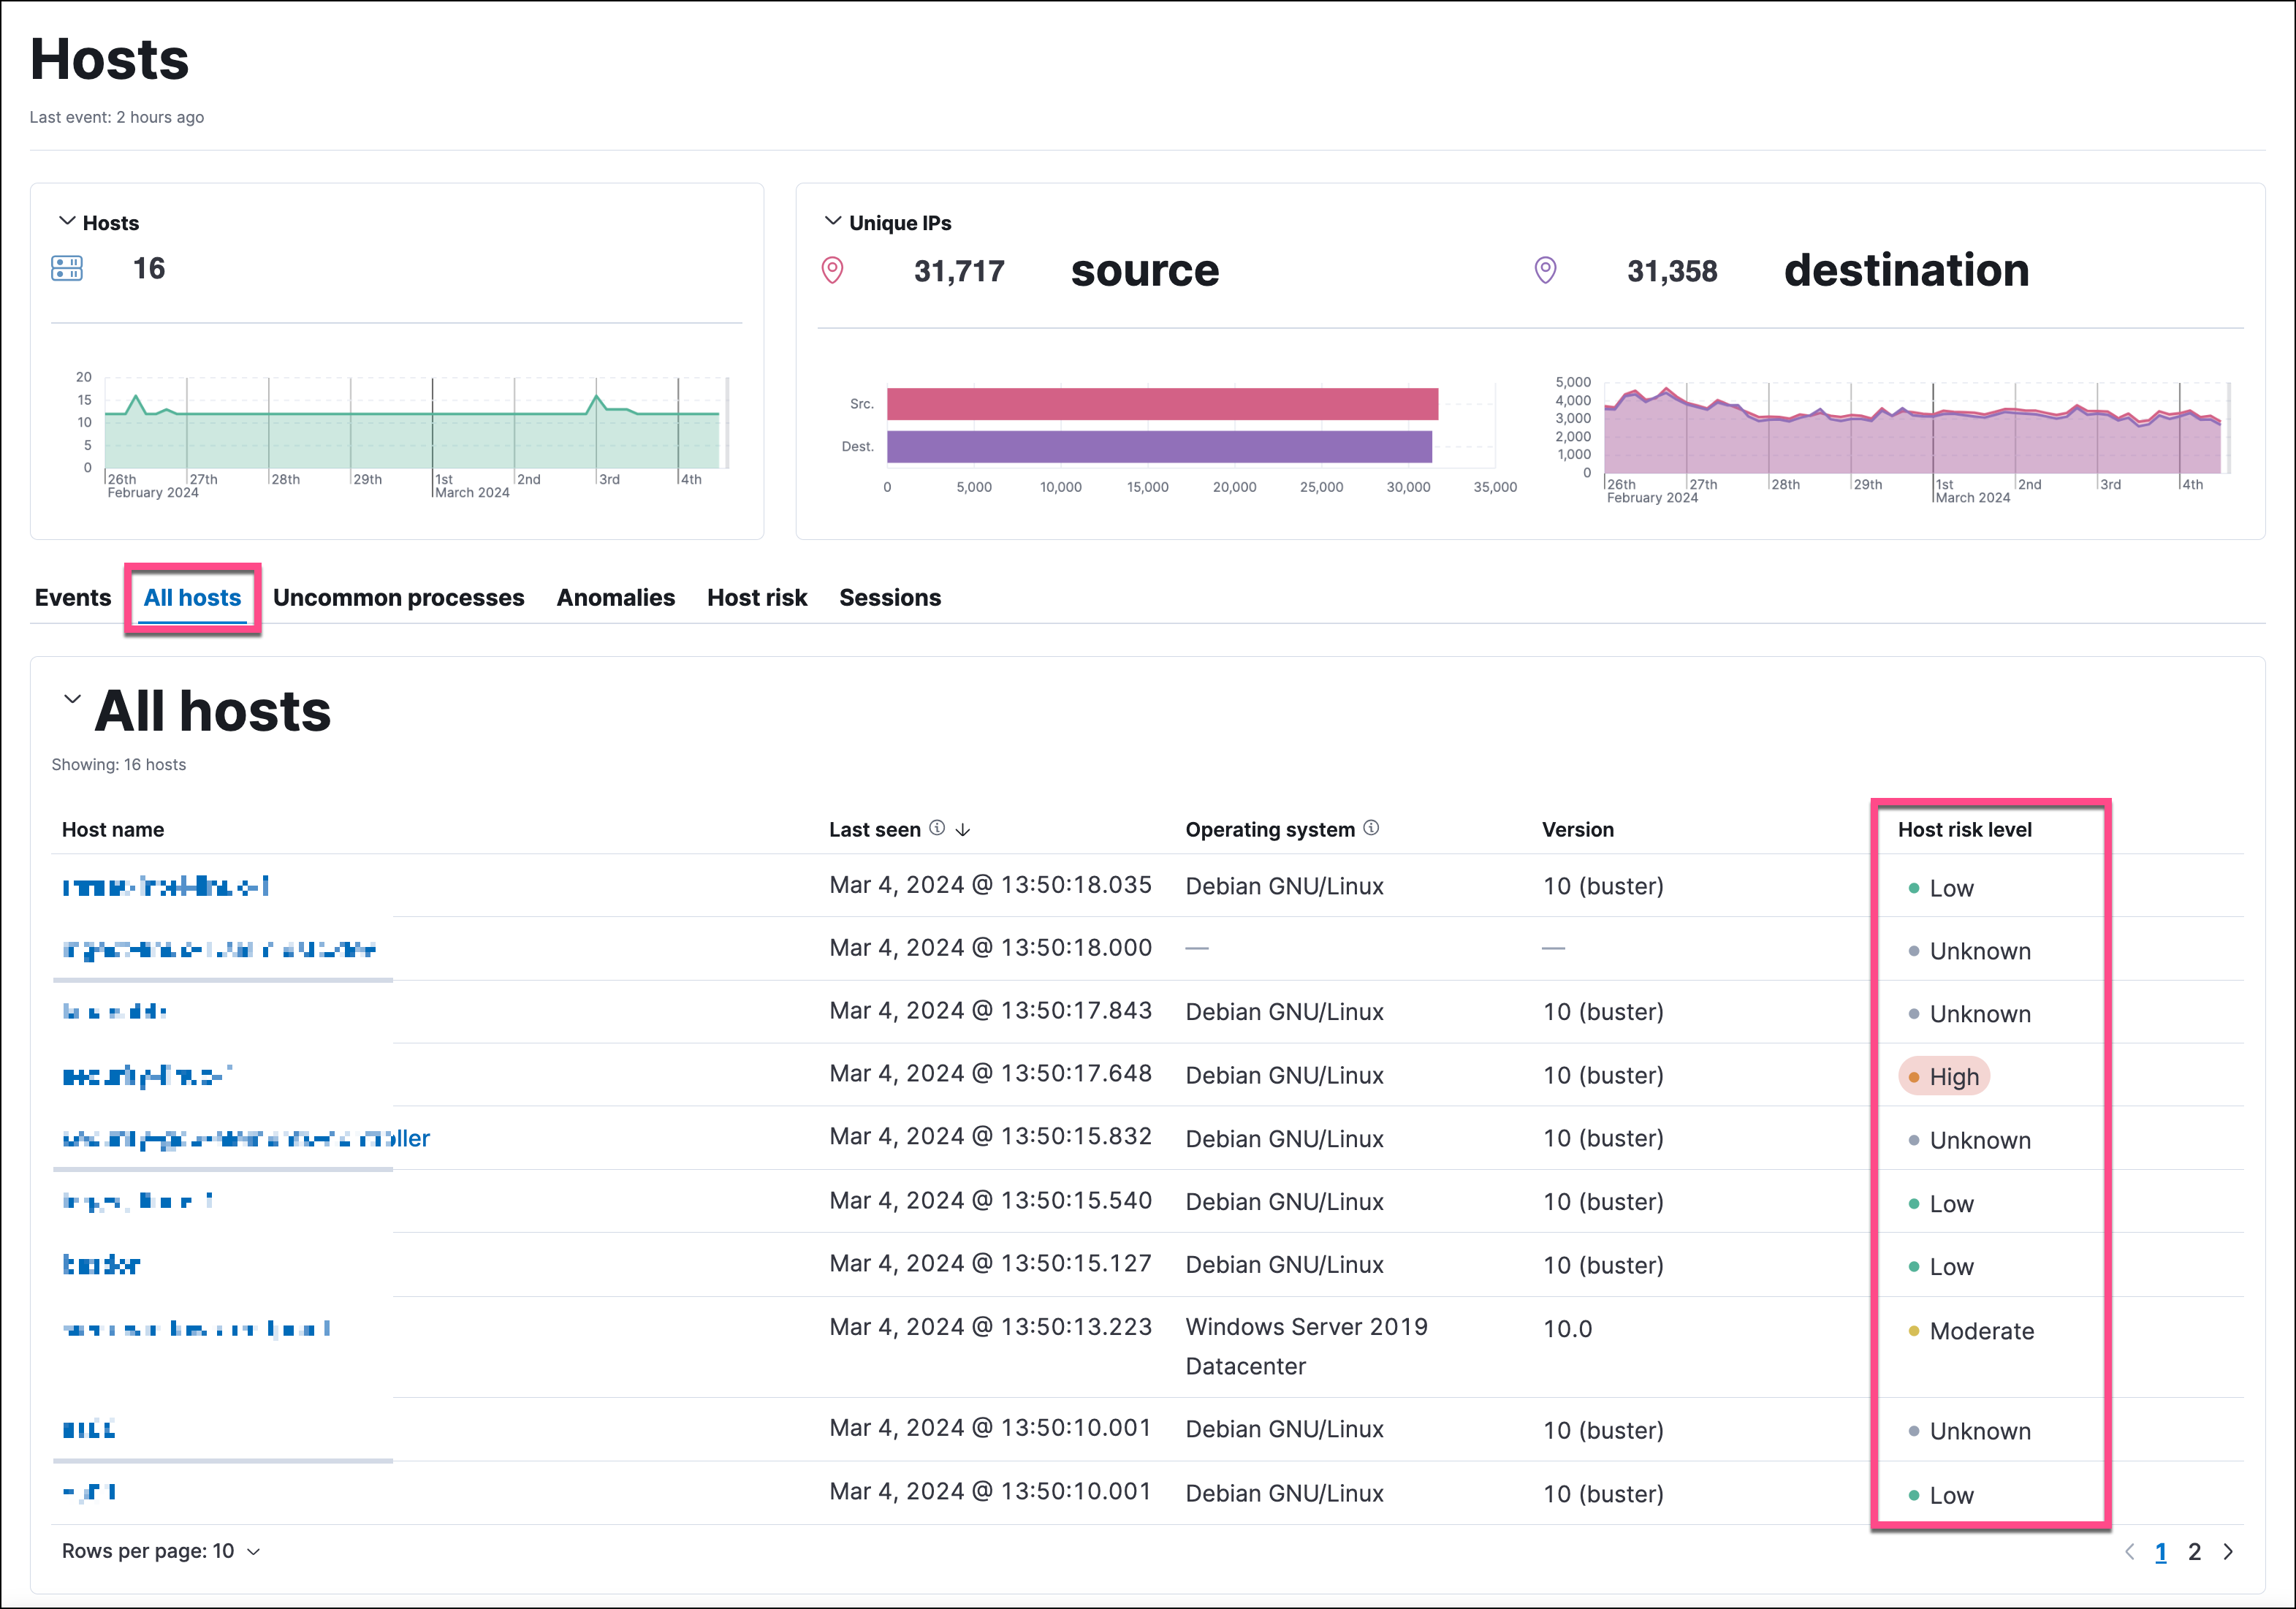
On the Hosts and Users pages, you can access the risk score data:
In the Host risk level or User risk level column on the All hosts or All users tab:
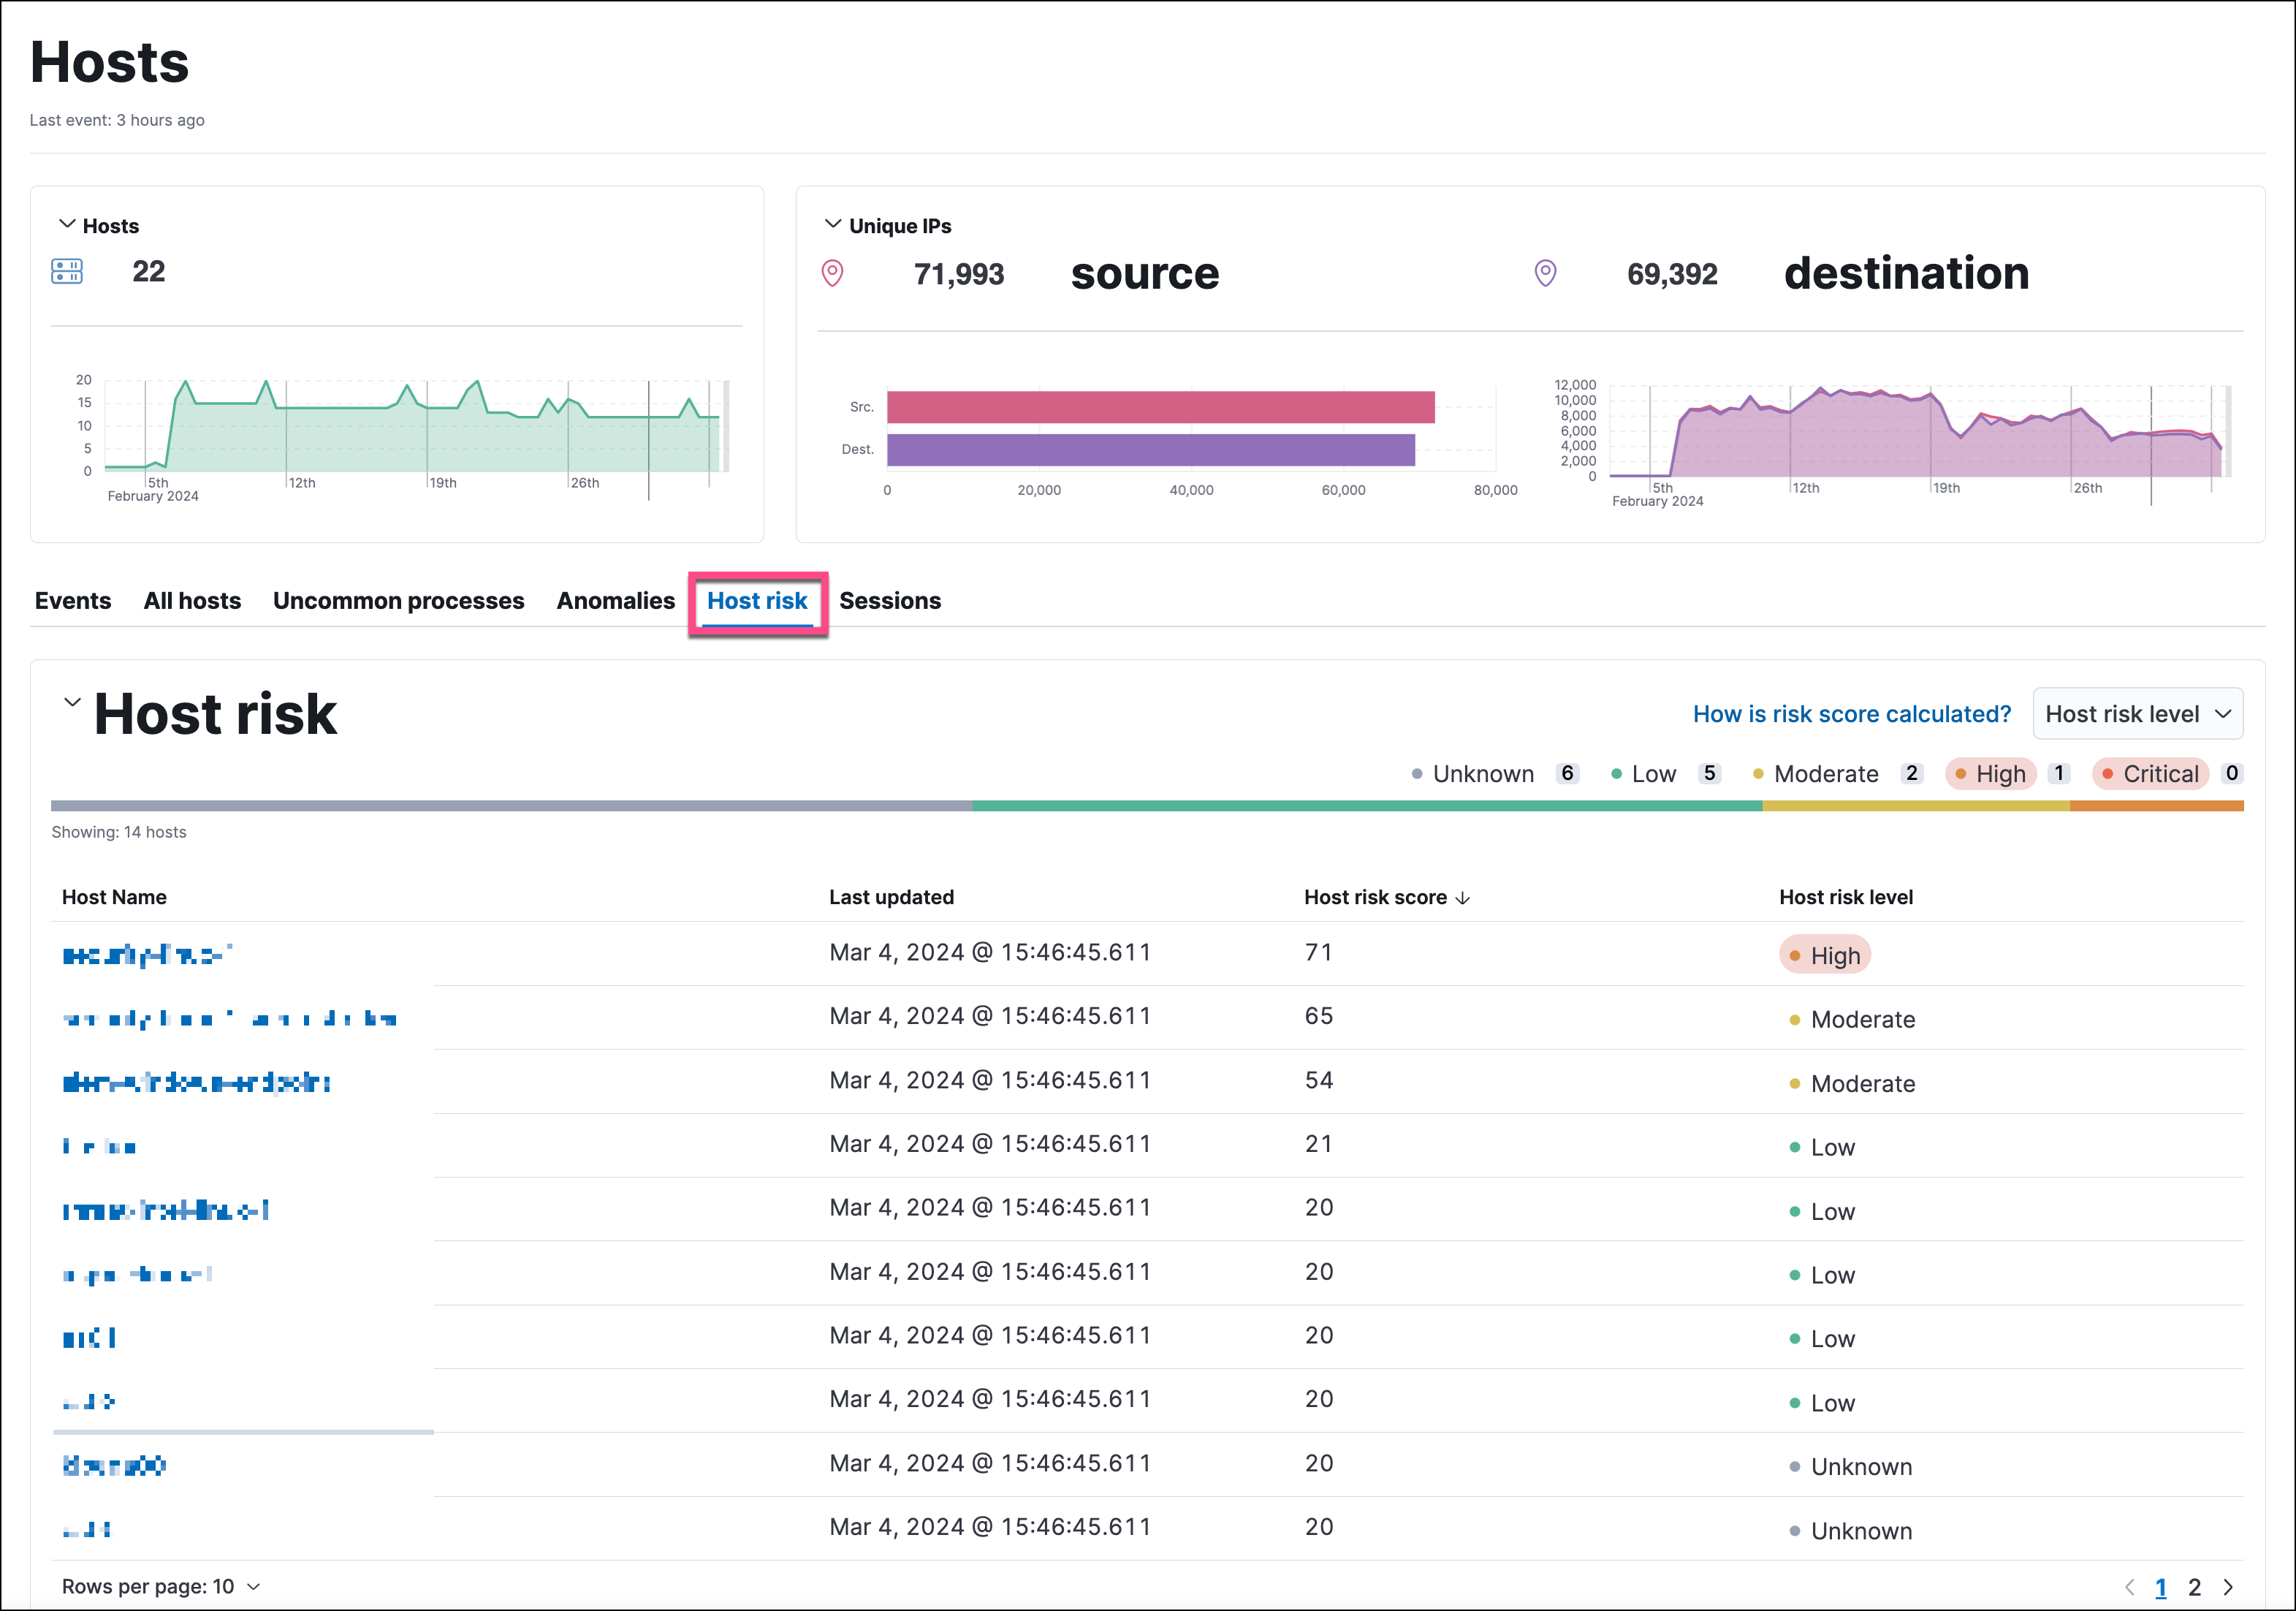
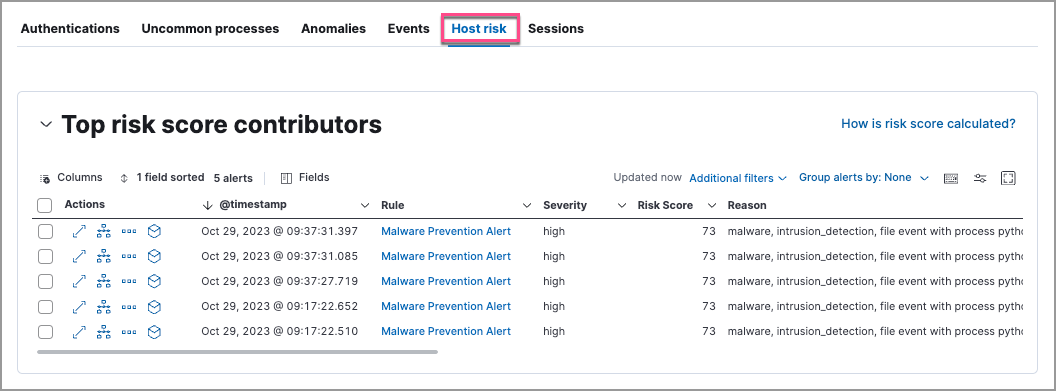
On the Host risk or User risk tab:
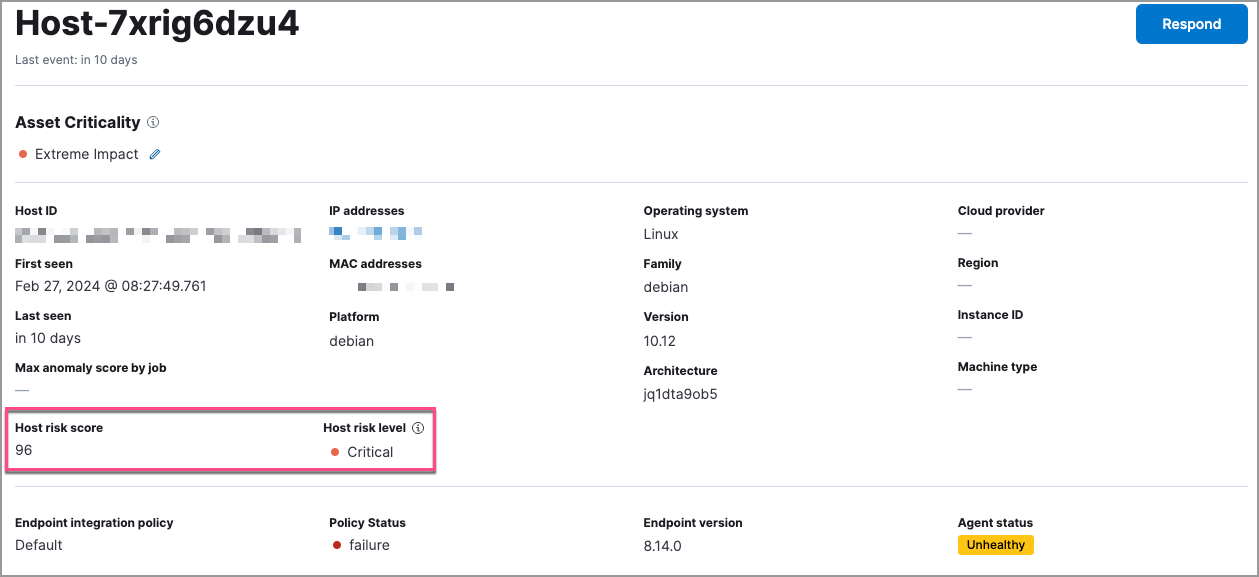
On the host details and user details pages, you can access the risk score data:
In the Overview section:
On the Host risk or User risk tab:
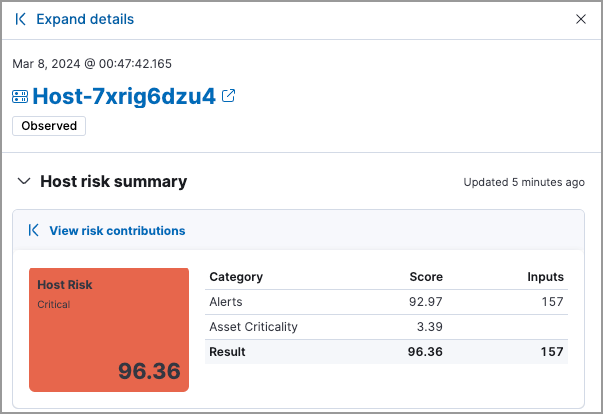
In the host details and user details flyouts, you can access the risk score data in the risk summary section: