Monitor rule executions
Several tools can help you gain insight into the performance of your detection rules:
- Rule Monitoring tab — The current state of all detection rules and their most recent executions. Go to the Rule Monitoring tab to get an overview of which rules are running, how long they’re taking, and if they’re having any trouble.
- Execution results — Historical data for a single detection rule’s executions over time. Consult the execution results to understand how a particular rule is running and whether it’s creating the alerts you expect.
- Detection rule monitoring dashboard — Visualizations to help you monitor the overall health and performance of Elastic Security's detection rules. Consult this dashboard for a high-level view of whether your rules are running successfully and how long they’re taking to run, search data, and create alerts.
Refer to the Troubleshoot missing alerts section for strategies on adjusting rules if they aren’t creating the expected alerts.
To view a summary of all rule executions, including the most recent failures and execution times, select the Rule Monitoring tab on the Rules page. To access the tab, find Detection rules (SIEM) in the navigation menu or look for “Detection rules (SIEM)” using the global search field, then go to the Rule Monitoring tab.
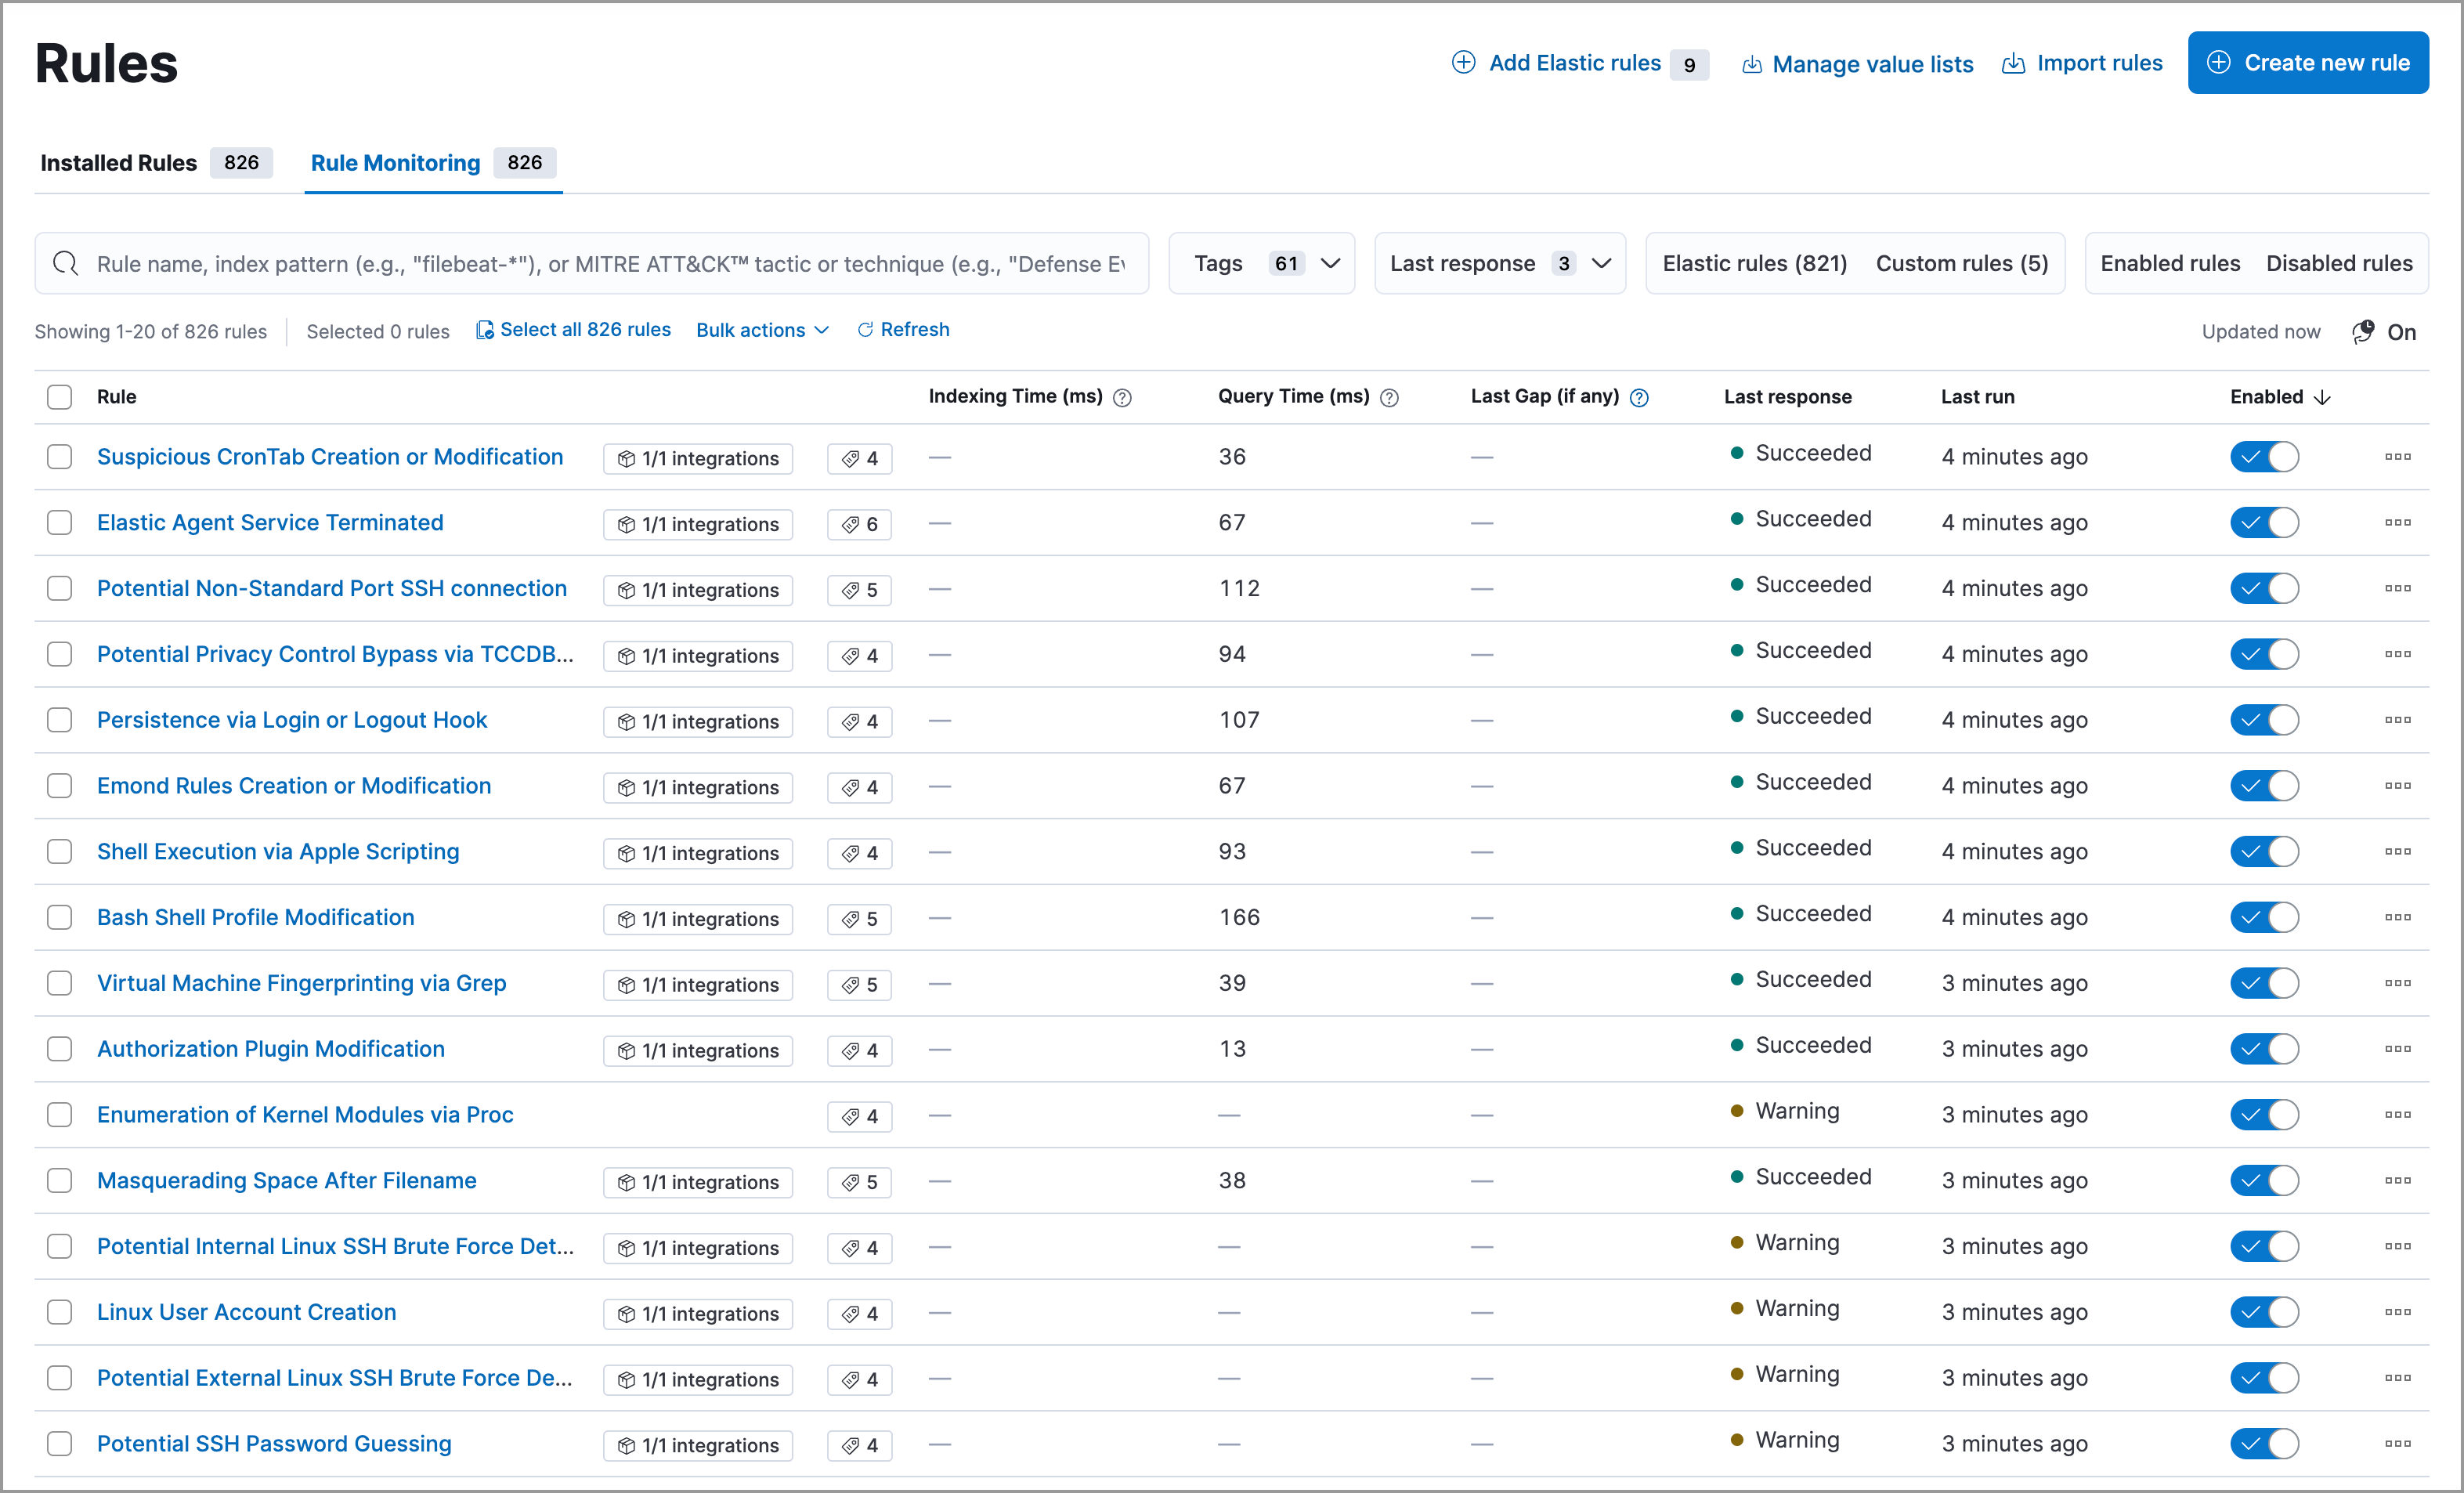
On the Rule Monitoring tab, you can sort and filter rules just like you can on the Installed Rules tab.
To sort the rules list, click any column header. To sort in descending order, click the column header again.
For detailed information on a rule, the alerts it generated, and associated errors, click on its name in the table. This also allows you to perform the same actions that are available on the Installed Rules tab, such as modifying or deleting rules, activating or deactivating rules, exporting or importing rules, and duplicating prebuilt rules.
Each detection rule execution is logged, including the execution type, the execution’s success or failure, any warning or error messages, how long it took to search for data, create alerts, and complete. This can help you troubleshoot a particular rule if it isn’t behaving as expected (for example, if it isn’t creating alerts or takes a long time to run).
To access a rule’s execution log, click the rule’s name to open its details, then scroll down and select the Execution results tab. Within the Execution log table, you can click the arrow at the end of a row to expand a long warning or error message.
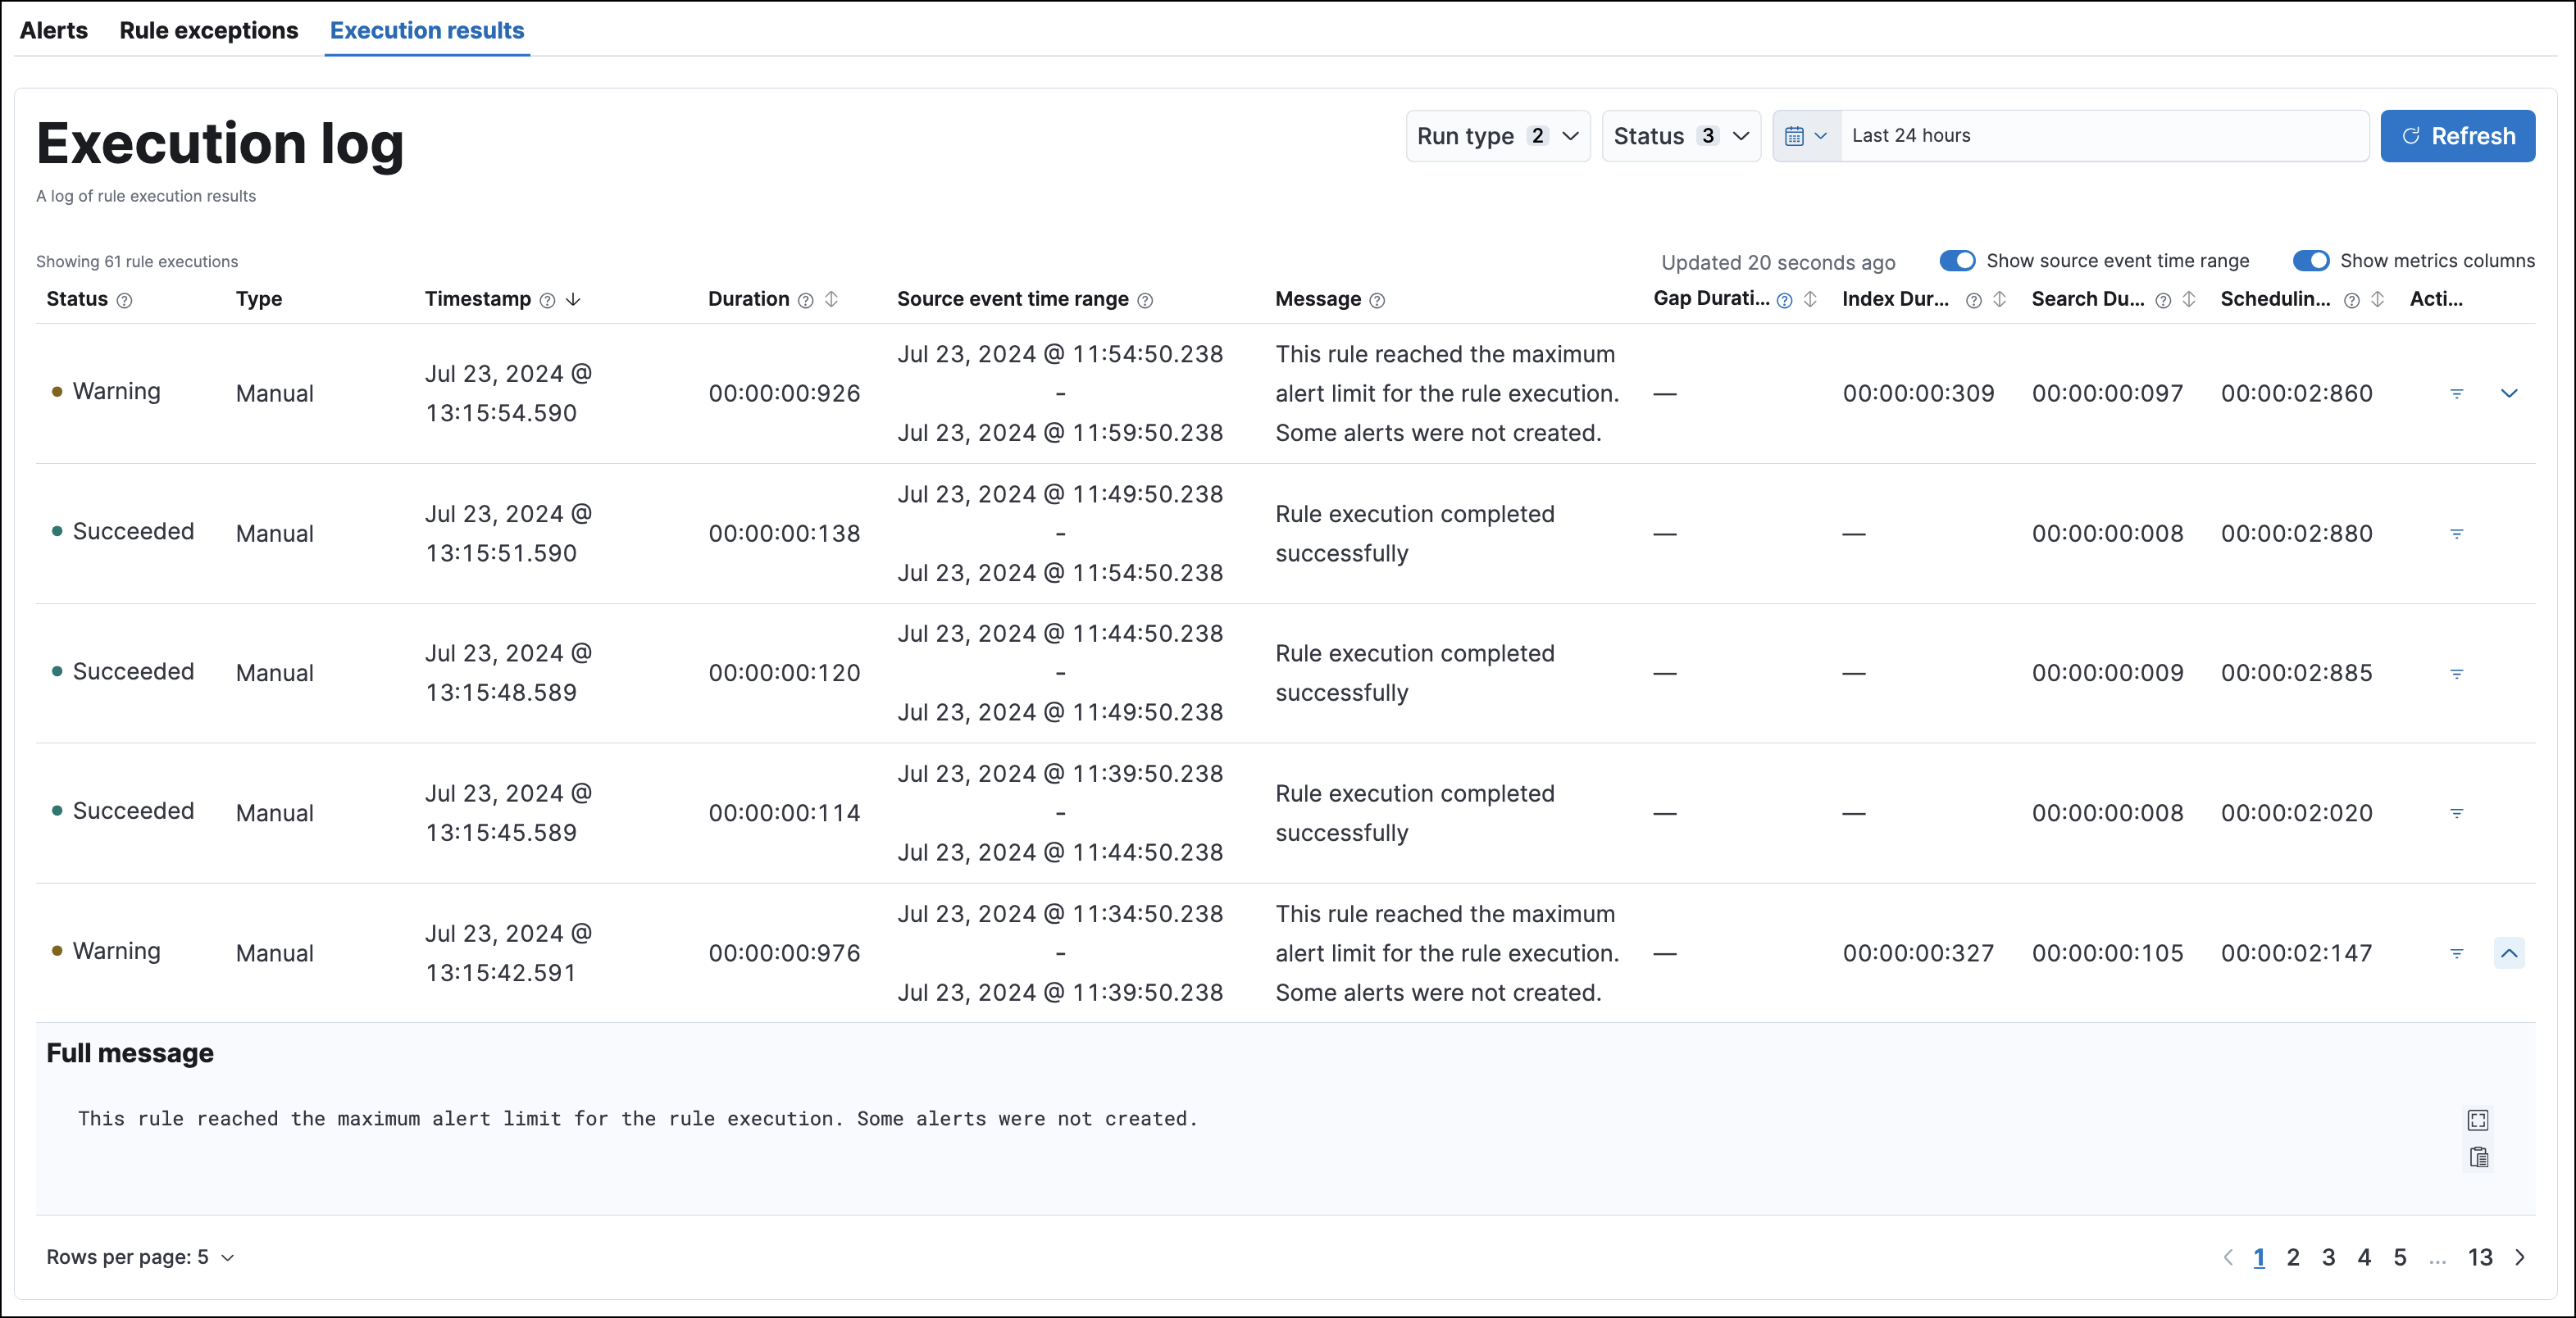
You can hover over each column heading to display a tooltip about that column’s data. Click a column heading to sort the table by that column.
Use these controls to filter what’s included in the logs table:
The Run type drop-down filters the table by rule execution type:
- Scheduled: Automatic, scheduled rule executions.
- Manual: Rule executions that were started manually.
The Status drop-down filters the table by rule execution status:
- Succeeded: The rule completed its defined search. This doesn’t necessarily mean it generated an alert, just that it ran without error.
- Failed: The rule encountered an error that prevented it from running. For example, a machine learning rule whose corresponding machine learning job wasn’t running.
- Warning: Nothing prevented the rule from running, but it might have returned unexpected results. For example, a custom query rule tried to search an index pattern that couldn’t be found in Elasticsearch.
The date and time picker sets the time range of rule executions included in the table. This is separate from the global date and time picker at the top of the rule details page.
The Source event time range button toggles the display of data pertaining to the time range of manual runs.
The Show metrics columns toggle includes more or less data in the table, pertaining to the timing of each rule execution.
The Actions column allows you to show alerts generated from a given rule execution. Click the filter icon (
 ) to create a global search filter based on the rule execution’s ID value. This replaces any previously applied filters, changes the global date and time range to 24 hours before and after the rule execution, and displays a confirmation notification. You can revert this action by clicking Restore previous filters in the notification.
This functionality is in beta and is subject to change. The design and code is less mature than official GA features and is being provided as-is with no warranties. Beta features are not subject to the support SLA of official GA features.
Each manual run can produce multiple rule executions, depending on the time range of the run and the rule’s execution schedule. These details are shown in the Manual runs table.
To access the table, navigate to the detection rules page, click the rule’s name to open its details, then scroll down and select the Execution results tab. Scroll down again to find the Manual runs table.
To stop an active run, go to the appropriate row and click Stop run in the Actions column. Completed rule executions for each manual run are logged in the Execution log table.
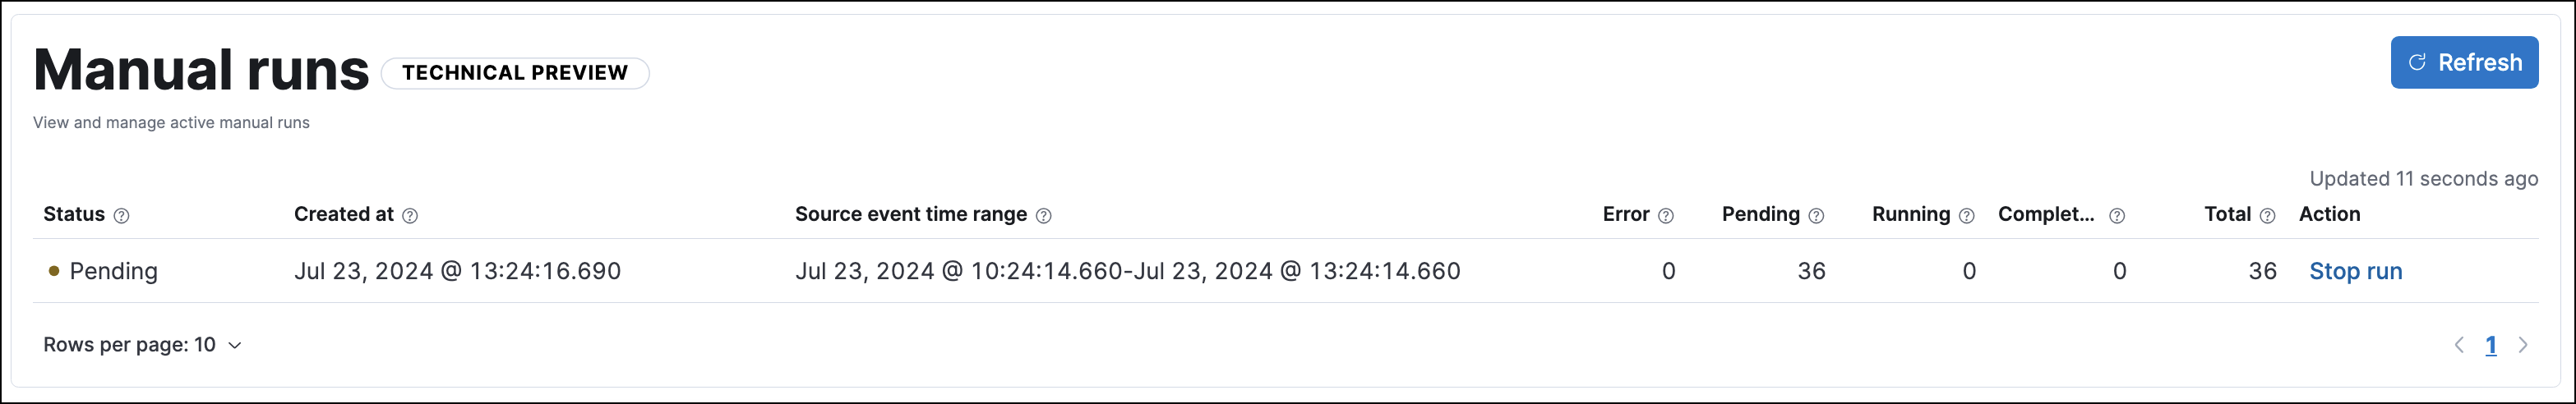
The Manual runs table displays important details such as:
The status of each manual run:
- Pending: The rule is not yet running.
- Running: The rule is executing during the time range you specified. Some rules, such as indicator match rules, can take longer to run.
- Error: The rule’s configuration is preventing it from running correctly. For example, the rule’s conditions cannot be validated.
When a manual run started and the time in which it will run
The number of rule executions that are failing, pending, running, and completed for a manual run
The total number of rule executions that are occurring for a manual run