Elastic Agent Builder traces overview dashboard
Elastic Agent Builder ships a prebuilt overview dashboard that turns your agent trace data into ready-made operational and usage metrics. Instead of building visualizations yourself, you install one managed dashboard and see how your agents behave, including how many tokens they use, how long conversations take, which agents run most often, and where tool calls fail.
Use the dashboard to:
- Track token usage and LLM request volume across models and providers.
- Spot slow conversations and long-running agent executions.
- Find tools that fail or run slowly.
The dashboard visualizes the trace data that Elastic Agent Builder sends to your Elasticsearch deployment, giving you a view of real agent activity. First, you must configure trace collection. Then install the dashboard in each Kibana space where you want to view the data.
The overview dashboard is a single prebuilt dashboard named [Elastic] Agent Builder Overview. It is a managed dashboard, so it is read-only. To change or extend it, duplicate it and edit the copy, as described in Customize the dashboard.
You install the dashboard separately in each Kibana space, and each copy shows only that space's trace data.
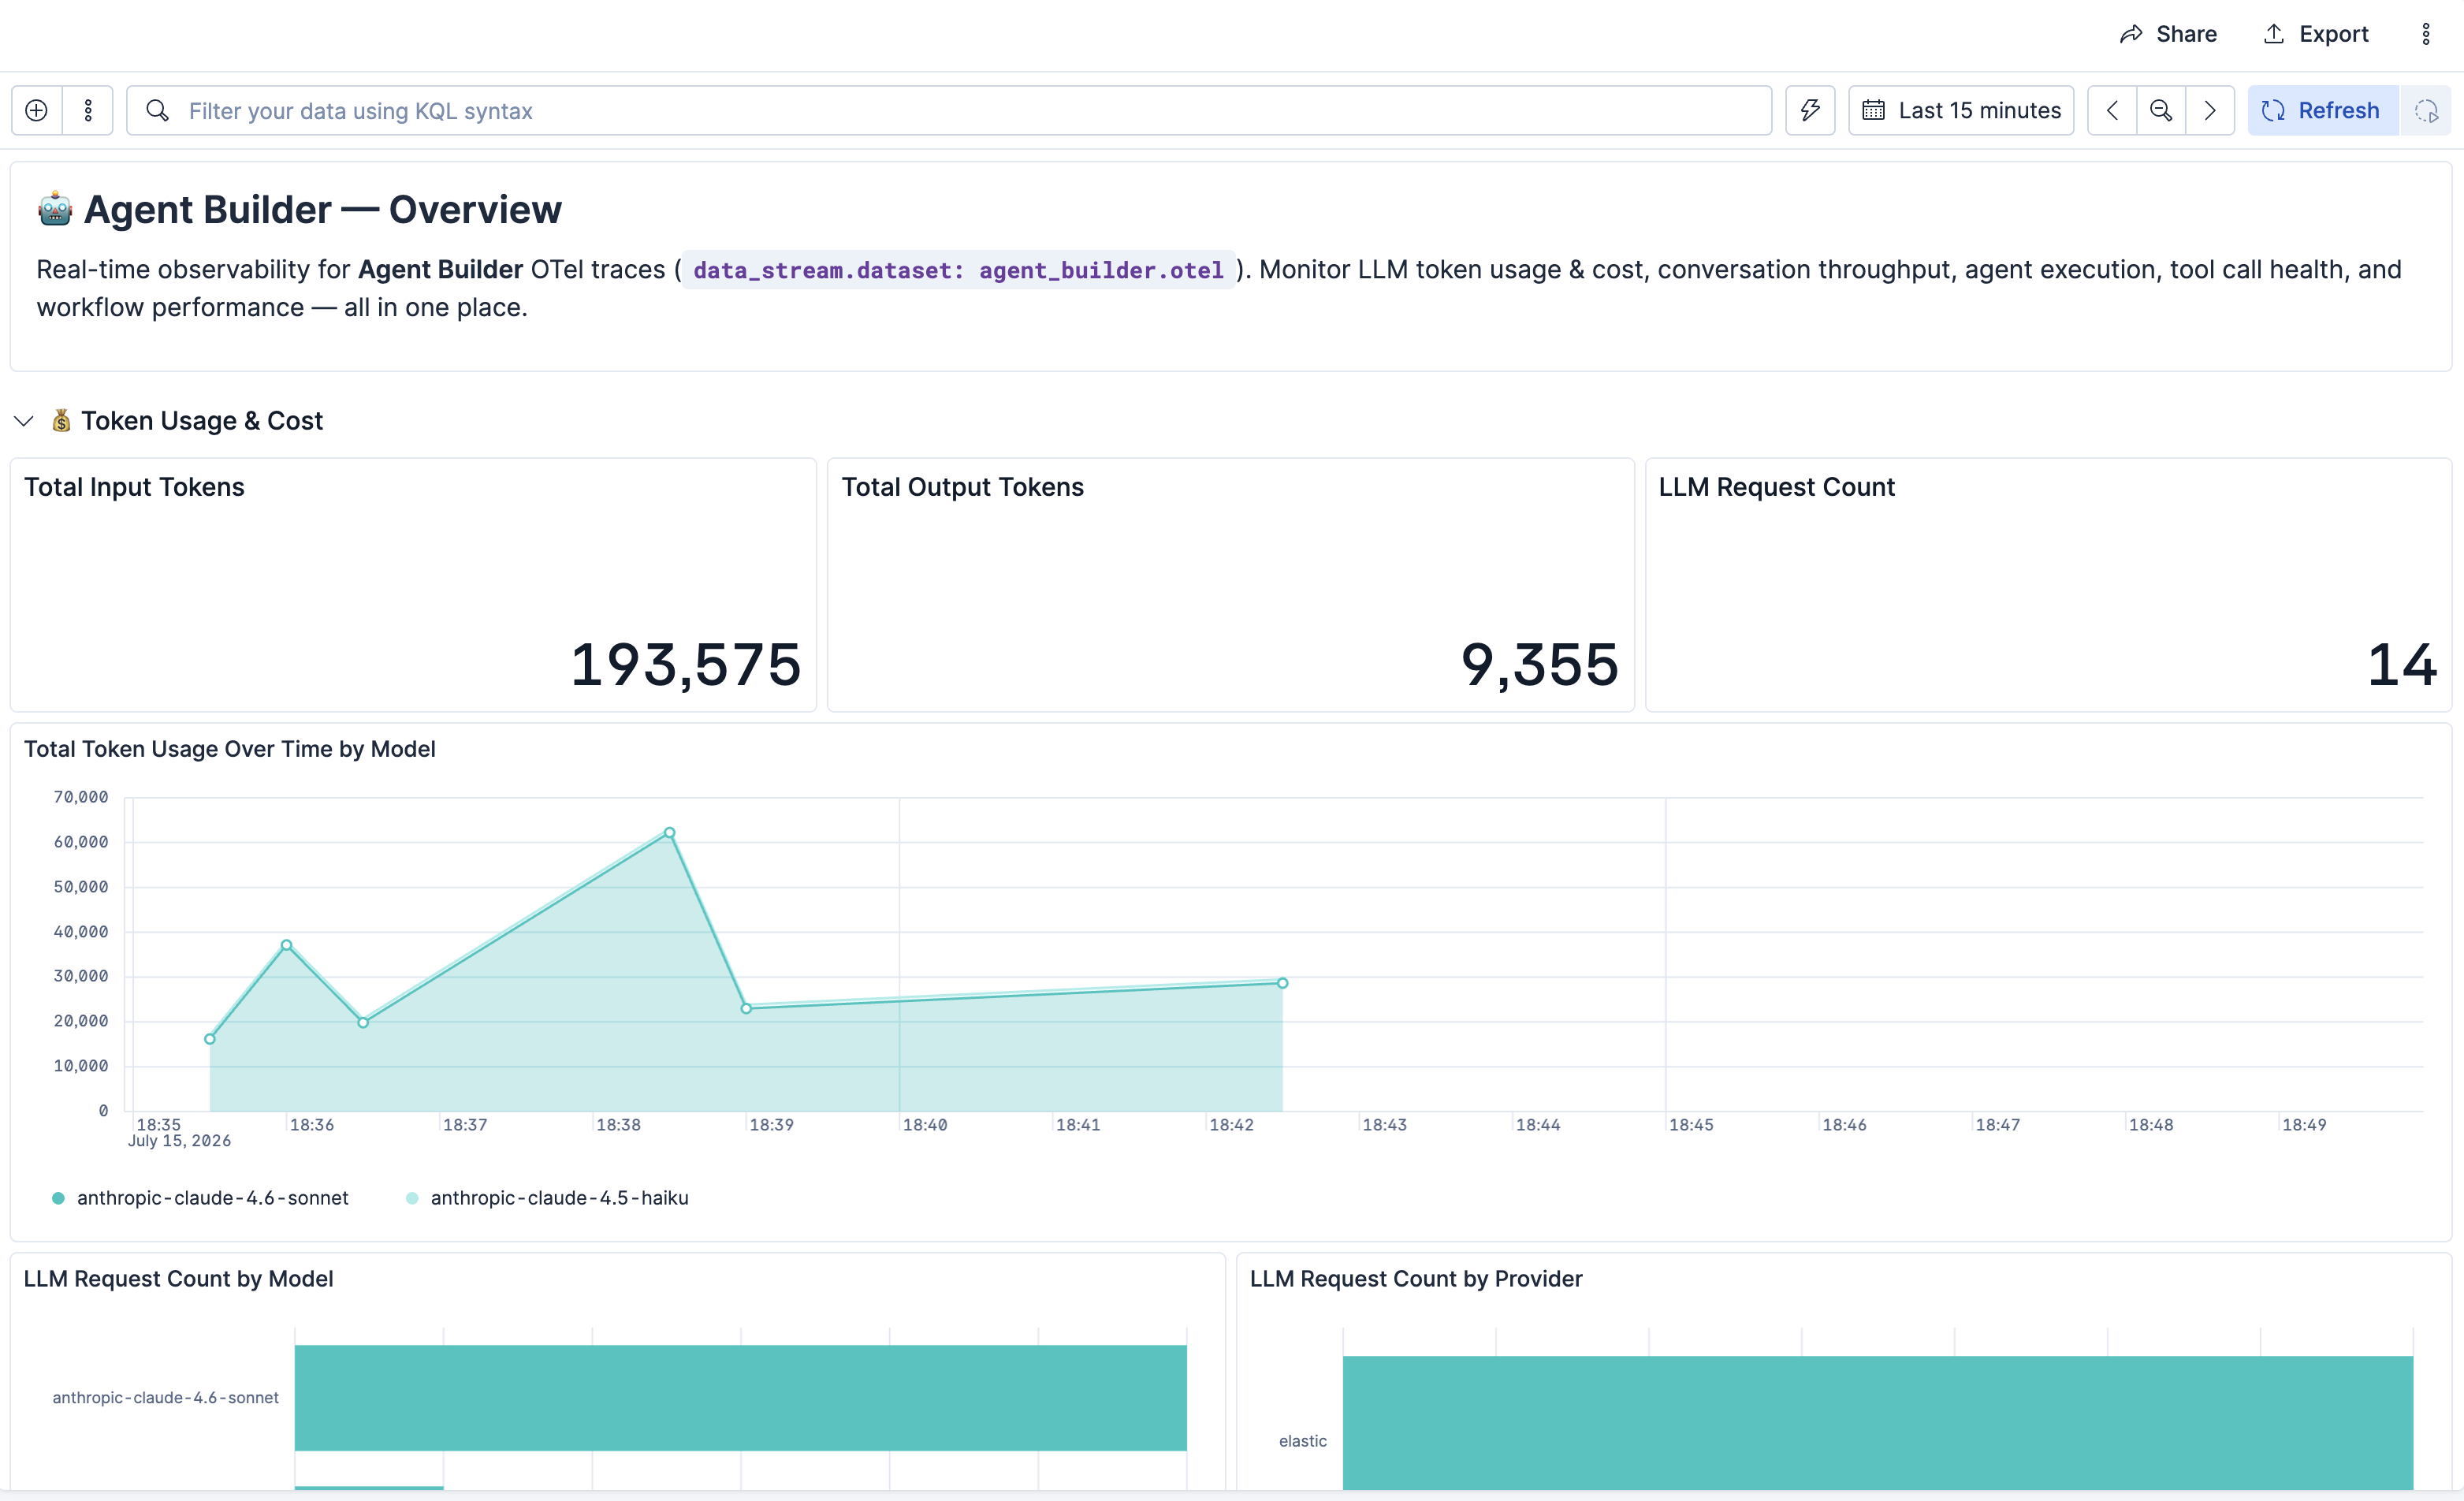
The dashboard groups its panels into four areas:
- Token Usage & Cost: Input and output tokens by model, and LLM request counts by model and provider.
- Conversation Volume & Latency: How many conversation rounds ran and how long they took, including average, 95th percentile, and maximum duration.
- Agent Execution: How often each agent ran and how long it took, broken down by agent.
- Tool Call Frequency & Errors: How often tools were called, their success and error rates, average tool duration, and the most-used tools. This section is collapsed when you install the dashboard, so expand it to see the panels.
When trace data is flowing, the dashboard looks like this:
Before you install the dashboard:
- Make sure trace collection is on for the space. It is on by default, so the Install Dashboard button is normally available straight away. If you have just changed the setting, save it first, because the button is hidden while the change is unsaved. For details, refer to Collect agent traces.
- Make sure you can read the trace data, otherwise the panels have no data to show. For the required privileges, refer to Read trace data.
- Make sure you can manage Kibana advanced settings. Installing and uninstalling the dashboard requires this privilege.
- Install the dashboard in each Kibana space where you want it. It is not shared across spaces.
The overview dashboard is not installed automatically. Install it once per Kibana space.
- Go to Stack Management → GenAI Settings.
- In the Agent Builder Traces section, confirm that Collect conversation traces is on and saved.
- Select Install Dashboard.
To open the dashboard, select View Dashboard, or open Dashboards and select [Elastic] Agent Builder Overview.
Repeat these steps in each space where you want the dashboard.
The dashboard is not restored automatically, including in a new space or after you remove it. If it is missing, open the Agent Builder Traces section and select Install Dashboard again.
To remove it, select the arrow next to View Dashboard, then select Uninstall dashboard.
The overview dashboard is managed, so you cannot edit it directly. To build your own version:
- Open the dashboard.
- Duplicate it.
- Edit and save the copy.
Because the original is managed, Elastic can ship improvements to it without overwriting your copy.
The dashboard panels are ES|QL queries over your trace data. To build your own visualizations in Dashboards, Lens, or Discover, query the trace data stream and filter by span type and attribute.
The dashboard's panels query span data from the traces-agent_builder.otel-* data stream, where each document is a span (a record of a single operation or unit of work in a trace). The dashboard identifies the kind of work a span represents from its span.name, and reads generative AI details from the span attributes. For the trace data stream and the read privileges, refer to Read trace data.
Each document is a span. Filter on the span.name field to select a kind of agent activity. The dashboard matches span names by prefix.
| Agent activity | Filter |
|---|---|
| LLM requests, tokens, model, and provider | span.name LIKE "chat *" |
| Conversation rounds (volume and latency) | span.name LIKE "invoke_agent *" and attributes.elastic.inference.span.kind == "CHAIN" |
| Agent executions | span.name LIKE "invoke_agent *" and attributes.elastic.inference.span.kind == "AGENT" |
| Tool calls | span.name LIKE "execute_tool *". For failures only, add status.code == "Error" |
These fields contain the details the dashboard aggregates. Generative AI attributes use the attributes. prefix.
| Field | Description |
|---|---|
attributes.gen_ai.usage.input_tokens |
Input tokens sent to the model |
attributes.gen_ai.usage.output_tokens |
Output tokens generated by the model |
attributes.gen_ai.request.model |
Model name |
attributes.gen_ai.provider.name |
Model provider |
attributes.gen_ai.agent.id |
Agent identifier |
attributes.gen_ai.conversation.id |
Conversation identifier |
attributes.elastic.inference.span.kind |
The kind of work a span represents: - LLM on chat spans- TOOL on execute_tool spans- CHAIN or AGENT on invoke_agent spans, where CHAIN is a conversation round and AGENT is an agent execution.Internal spans such as generate_title also use CHAIN, so combine this field with a span.name filter instead of using it on its own |
name |
Span name. On execute_tool spans it is execute_tool <tool-id>, for example execute_tool platform.core.list_indices. For the bare tool id, use attributes.gen_ai.tool.name |
duration |
Span duration in nanoseconds (root field). Divide by 1,000,000,000 for seconds |
status.code |
Span status, for example Error (root field) |
@timestamp |
When the span started |
The dashboard does not use these fields, but you can query them yourself. When an administrator opts in to capturing conversation content, prompts, responses, and tool call content are stored in the following attributes. Each one depends on a trace privacy setting, and all of those settings are off by default.
| Field | Span | Description | Required setting(s) |
|---|---|---|---|
attributes.gen_ai.input.messages |
chat |
Chat history sent to the model, as a series of user, assistant, and tool turns | Include user prompts in traces for the user turns, Include LLM responses in traces for the assistant turns, and Include tool call details in traces for the tool turns |
attributes.gen_ai.output.messages |
chat |
Model responses | Include LLM responses in traces |
attributes.gen_ai.system_instructions |
chat |
System prompt | Include system prompt in traces |
attributes.gen_ai.tool.call.arguments |
execute_tool |
Arguments passed to the tool | Include tool call details in traces |
attributes.gen_ai.tool.call.result |
execute_tool |
Value the tool returned | Include tool call details in traces |
Any turn that a privacy setting excludes is dropped from attributes.gen_ai.input.messages. When all three of the settings that govern it are off, the field is an empty array ([]). Filter those rows out, as the following example does.
Note that:
- The
attributes.gen_ai.tool.call.idfield on theexecute_toolspans is not affected by the privacy settings (though it is absent when a tool call has no id). - The Include tool call details in traces setting reaches further than the tool turns. When it is off, tool calls are also removed from the assistant turns that remain in both
attributes.gen_ai.input.messagesandattributes.gen_ai.output.messages, so an assistant turn keeps its text but not the call it made.
Spans also contain other content-bearing attributes:
- The
chatspans record the definitions of the tools offered to the model inattributes.gen_ai.tool.definitions(including each tool's description and parameter schema). - The
execute_toolspans record the tool's own description inattributes.gen_ai.tool.description.
Each content field holds a JSON string rather than indexed text, following the OpenTelemetry semantic conventions for generative AI:
- The message attributes hold an array of
{"role": ..., "parts": [...]}objects, where each part is atext,tool_call, ortool_call_responseitem. attributes.gen_ai.system_instructionsholds an array of{"type": ..., "content": ...}objects.
These content fields are keyword fields with ignore_above set to 1024. A value longer than 1024 characters is not indexed, and ES|QL returns it as null even though the full value is stored in the document. System prompts, model responses, and any chat history that contains a tool result routinely pass 1024 characters, so treat ES|QL as dependable only for short values here.
Reading full content
To read the full content, request the document with Elasticsearch search instead of ES|QL, and ask for _source. The fields option applies the same limit and returns nothing.
Finding affected spans
To find the affected spans in the first place, use the _ignored metadata field, which lists the fields on a document that were not indexed. For these attributes, that means the value passed the length limit. It is available both on search hits and in ES|QL, as shown in Example queries.
Tool arguments and results
Tool arguments and results are also recorded on the execute_tool spans, in attributes.gen_ai.tool.call.arguments and attributes.gen_ai.tool.call.result. Each of those holds one tool call rather than the whole conversation, so it is less likely to pass the limit, though a large tool result still can. Prefer them when you query tool activity with ES|QL.
Use these as starting points, and test them on your own data. They query one space. Replace default in traces-agent_builder.otel-default with your space id. To query across all spaces at once, use the traces-agent_builder.otel-* wildcard, which combines data from every space.
FROM traces-agent_builder.otel-default
| WHERE span.name LIKE "chat *"
| STATS
    input_tokens = SUM(TO_LONG(attributes.gen_ai.usage.input_tokens)),
    output_tokens = SUM(TO_LONG(attributes.gen_ai.usage.output_tokens))
  BY model = attributes.gen_ai.request.model,
     provider = attributes.gen_ai.provider.name
| SORT input_tokens DESC
FROM traces-agent_builder.otel-default
| WHERE span.name LIKE "execute_tool *"
| STATS
    calls = COUNT(*),
    errors = COUNT(*) WHERE status.code == "Error"
  BY tool = name
| SORT calls DESC
Requires Include user prompts in traces:
FROM traces-agent_builder.otel-default
| WHERE span.name LIKE "chat *"
| WHERE attributes.gen_ai.input.messages != "[]"
| SORT @timestamp DESC
| LIMIT 20
| KEEP @timestamp, attributes.gen_ai.input.messages
This returns only the messages that are short enough to be indexed. Anything over 1024 characters is null here and does not match the filter, so use a search request for those, as described in Message content attributes.
FROM traces-agent_builder.otel-default METADATA _ignored
| WHERE _ignored == "attributes.gen_ai.input.messages"
| SORT @timestamp DESC
| LIMIT 20
| KEEP @timestamp, name, _ignored
The _ignored column lists every field on the span that was dropped, so you can see at a glance which content is only available through a search request.