Using
Search and filter your dashboard data 
Kibana supports several ways to explore the data displayed in a dashboard more in depth:
- The query bar, using KQL expressions by default.
- The time range, that allows you to display data only for the period that you want to focus on. You can set a global time range for the entire dashboard, or specify a custom time range for each panel.
- Controls, that dashboard creators can add to help viewers filter on specific values.
- Filter pills, that you can add and combine by clicking on specific parts of the dashboard visualizations, or by defining conditions manually from the filter editor. The filter editor is a good alternative if you’re not comfortable with using KQL expressions in the main query bar.
- View the data of a panel and the requests used to build it.
This section shows the most common ways for you to filter dashboard data. For more information about Kibana and Elasticsearch filtering capabilities, refer to Kibana concepts.
Use filter pills 
Use filter pills to focus in on the specific data you want.

Add pills by interacting with visualizations 
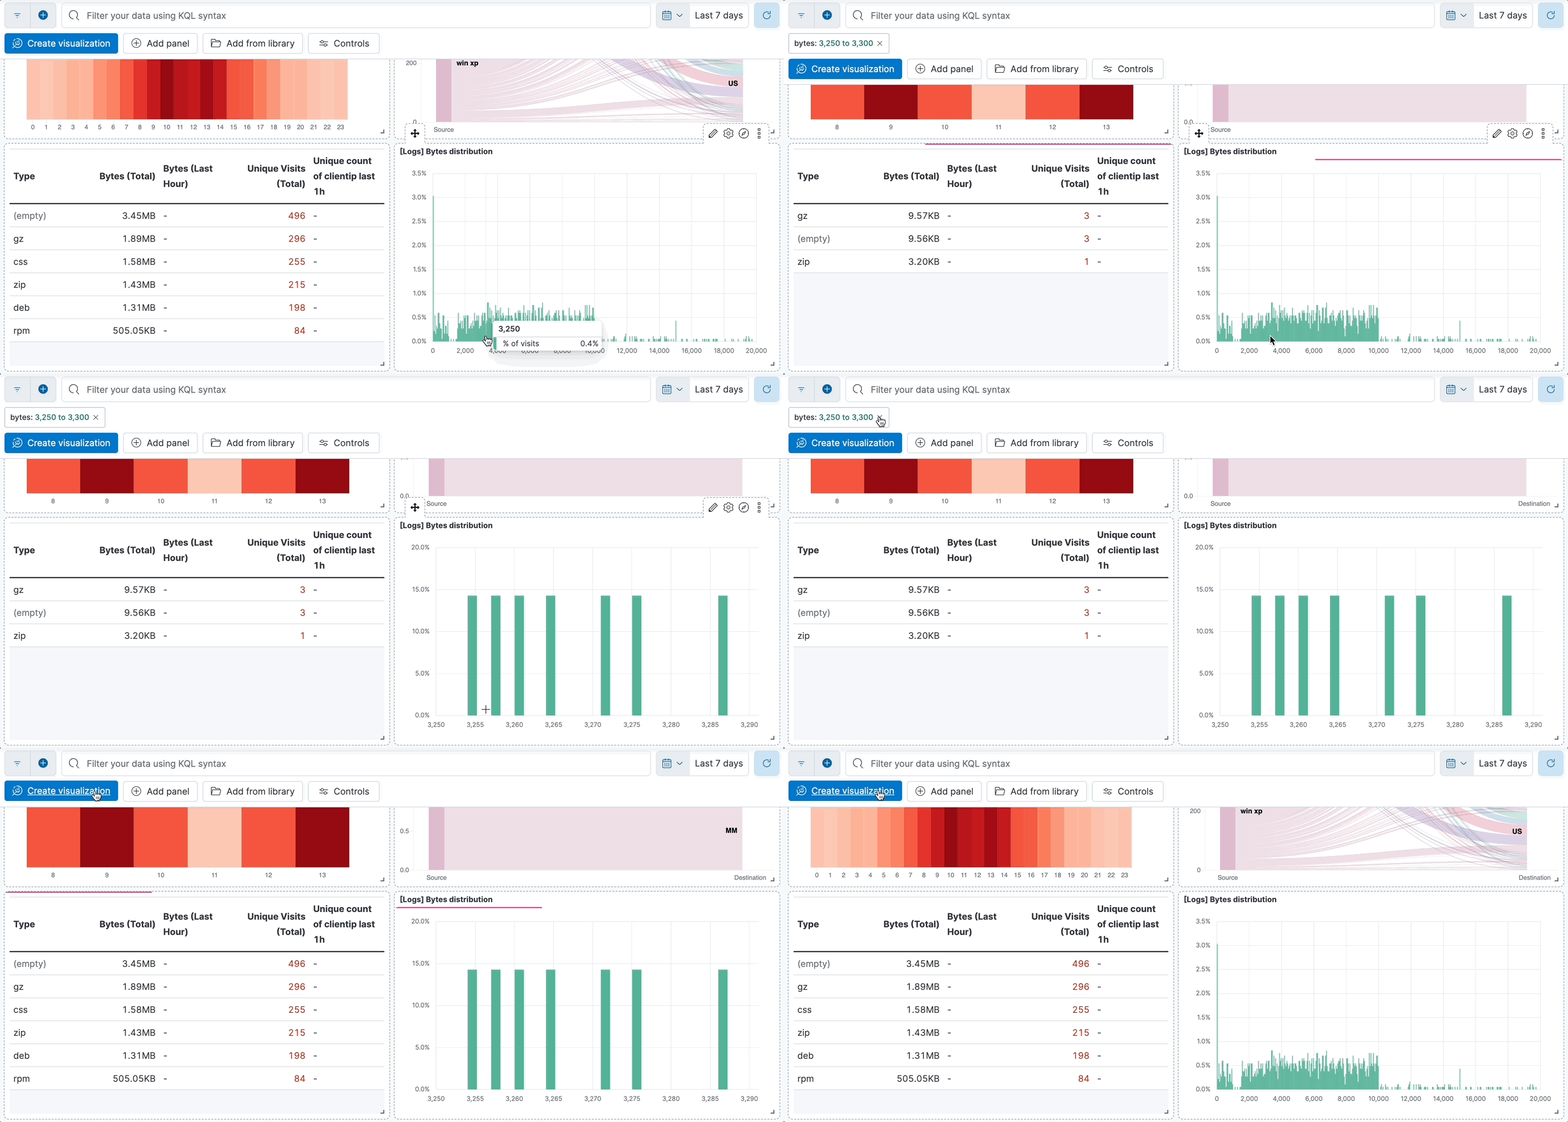
You can interact with some panel visualizations to explore specific data more in depth. Upon clicking, filter pills are added and applied to the entire dashboard, so that surrounding panels and visualizations also reflect your browsing.

Add pills using the filter editor 
As an alternative to the main query bar, you can filter dashboard data by defining individual conditions on specific fields and values, and by combining these conditions together in a filter pill.

Filter dashboards using the KQL query bar 
The query bar lets you build filters using Kibana Query Language (KQL). When typing, it dynamically suggests matching fields, operators, and values to help you get the exact results that you want.

Set a time range 
The data visible in a dashboard highly depends on the time range that is applied. In a dashboard, you can select a time range that applies globally to all panels, or set a custom time range for specific panels.
Apply a global time range to an entire dashboard 
The global time range menu is located right next to the query bar, in the dashboard’s header. With this menu, you can select the time range to apply, and set the frequency for refreshing the dashboard data. Setting the time range is a common action in Kibana. Refer to Set the time range for more details.

Apply a custom time range to a panel 
To apply a panel-level time range:
- Hover over the panel and click
 . The Settings flyout appears.
 - Turn on Apply a custom time range.
- Enter the time range you want to view, then click Apply.
To view and edit the time range applied to a specific panel:
When a custom time range is active for a single panel, it is indicated in the panel’s header.
To edit it, click the filter. You can then adjust and apply the updated Time range.
Use available controls 
Dashboard authors can add various types of additional controls to help you filter the data that you want to visualize.
Filter the data with Options list controls 
Filter the data with one or more options that you select.
- Open the Options list dropdown.
- Select the available options. Selecting Exists returns all documents that contain an indexed value for the field.
- Select how to filter the options.
- To display only the data for the options you selected, select Include.
- To exclude the data for the options you selected, select Exclude.
- To clear the selections, click
 .
. - To display only the options you selected in the dropdown, click
 .
.

Filter the data with Range slider controls 
Filter the data within a specified range of values.
- On the Range slider, click a value.
- Move the sliders to specify the values you want to display. The dashboard displays only the data for the range of values you specified.
- To clear the specified values, click
 .
.

Filter the data with time slider controls 
Filter the data within a specified range of time.
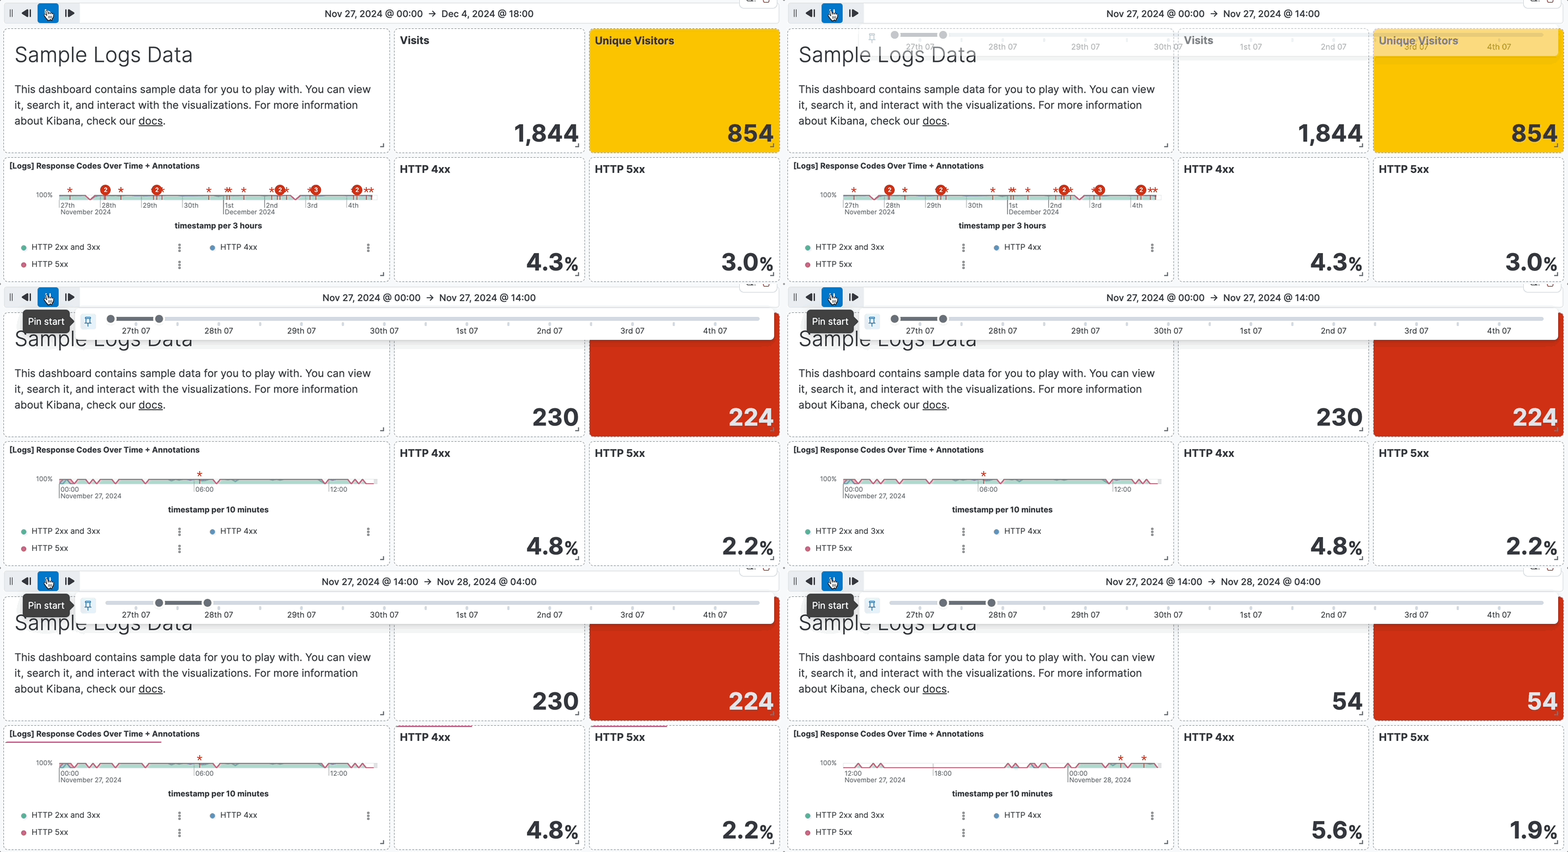
- To view a different time range, click the time slider, then move the sliders to specify the time range you want to display.
- To advance the time range forward, click
 .
. - To advance the time range backward, click
 .
. - To animate the data changes over time, click
 .
. - To clear the specified values, click
 .
.

View the panel data and requests 
View the data in visualizations and the requests that collect the data:
- Open the panel menu and select Inspect.
- View and download the panel data.
- Open the View dropdown, then click Data.
- Click Download CSV, then select the format type from the dropdown:
- Formatted CSV — Contains human-readable dates and numbers.
- Unformatted — Best used for computer use. When you download visualization panels with multiple layers, each layer produces a CSV file, and the file names contain the visualization and layer data view names.
- View the requests that collect the data.
- Open the View dropdown, then click Requests.
- From the dropdown, select the requests you want to view.
- To view the requests in Console, click Request, then click Open in Console.
View the time range on specific panels:
When a custom time range is active for a single panel, it is indicated in the panel’s header.
You can view it in more details and edit it by clicking the filter.
Full screen mode and maximized panel views 
You can display dashboards in full screen mode to gain visual space and view or show visualizations without the rest of the Kibana interface.

If you need to focus on a particular panel, you can maximize it by opening the panel menu and selecting Maximize. You can minimize it again the same way.
Tip
When sharing a dashboard with a link while a panel is in maximized view, the generated link will also open the dashboard on the same maximized panel view.
