HackerOne Integration for Elastic
| Version | 0.3.0
|
| Subscription level What's this? |
Basic |
| Developed by What's this? |
Elastic |
| Ingestion method(s) | API |
| Minimum Kibana version(s) | 9.1.0 8.19.0 |
To use pre-release integrations, go to the Integrations page in Kibana, scroll down, and toggle on the Display beta integrations option.
The HackerOne integration brings your bug bounty and vulnerability disclosure reports into Elastic Security. Use it to monitor submissions from security researchers, track report status, and analyze vulnerability data alongside your other security tools.
The integration checks HackerOne on a schedule you choose and pulls in new or updated reports. After the first run, it only collects reports that changed since the last check, so you stay up to date without duplicate data.
This integration works with the HackerOne Customer API. You need an organization API token from a Professional, Community, or Enterprise program. You can also use the free Sandbox program to test the integration.
On each scheduled run, the integration:
- Connects to HackerOne using your API token.
- Fetches reports for the programs or inboxes you specify.
- Sends each report to Elasticsearch for search, dashboards, and alerting.
When a report is updated in HackerOne (for example, triaged or resolved), the integration picks up the change on the next run.
Each report includes details such as:
- Status and timeline — when the report was created, triaged, closed, disclosed, and last updated.
- Vulnerability details — title, description, severity rating, CVSS score, weakness type, and CVE IDs when available.
- People involved — the researcher who submitted the report, assignee, program, and collaborators.
- Scope and rewards — the affected asset, bounty and swag awards, attachments, and remediation guidance.
- Monitor vulnerability disclosure programs from a single place in Elastic Security.
- Build SLA dashboards using response-time and resolution-time metrics.
- Track bounty spending across programs.
Before you install the integration, gather the following from your HackerOne organization:
- API access. API tokens are available on Professional, Community, and Enterprise programs. Use the free Sandbox program for testing.
- An organization API token with Report management permission. As an Organization Administrator, go to Organization Settings → API Tokens to create one. Save both the identifier and the value when the token is created — the value is shown only once.
- At least one program handle or inbox ID to tell the integration which reports to collect.
- Program handle — the name in your program URL:
https://hackerone.com/<handle>(for example,acme). - Inbox ID — the numeric ID from your inbox settings page URL.
- Program handle — the name in your program URL:
- (Optional) IP allowlist entry — if your organization restricts API access by IP, add the outbound IP address of the Elastic Agent host.
Elastic Agent must be installed. For more details, check the Elastic Agent installation instructions. You can install only one Elastic Agent per host.
- In Kibana, go to Integrations and search for HackerOne.
- Click Add HackerOne.
- Fill in the required settings:
- URL — HackerOne API address (default:
https://api.hackerone.com). - API token identifier — the identifier from your API token.
- API token value — the secret value from your API token.
- Program handles and/or Inbox IDs — at least one is required.
- Interval — how often to check for new reports (default: every 5 minutes).
- Initial lookback — how far back to fetch reports on the first run (default: 24 hours).
- Page size — number of reports retrieved per request (default: 100).
- URL — HackerOne API address (default:
- Optionally narrow what is collected with State filter and Severity filter.
- Save the integration policy and assign it to an Elastic Agent policy.
After the integration is running, open Discover in Kibana and search for event.dataset: "hackerone.report". You should see reports within one polling interval (default: 5 minutes) after they are created or updated in HackerOne.
When the integration is installed, a transform maintains the latest state of each HackerOne report in a lookup index (logs-hackerone_latest.report). You can enrich other security data with HackerOne report metadata at query time using ES|QL LOOKUP JOIN on event.id (the HackerOne report identifier).
Join keys must be single-valued: a report can list several CVE identifiers, so hackerone.report.attributes.cve_ids could not match and adds only null columns.
For help with Elastic ingest tools, check Common problems.
- 401 Unauthorized — The API token identifier or value is wrong. Make sure you entered the token identifier (not your email address) in the identifier field.
- 403 Forbidden — The token is valid, but access was denied. Check that the Elastic Agent's IP address is on your organization's allowlist, and that the token has access to the programs you configured.
- 429 Too Many Requests — HackerOne limits how many requests you can make per minute. Try increasing the polling interval or collecting fewer programs with a single agent.
- No documents indexed — Confirm that at least one Program handle or Inbox ID is set. The integration needs at least one to know which reports to collect.
For guidance on scaling data ingestion, see Ingest Architectures.
A single agent can handle many programs at the default 5-minute interval. If you set a long initial lookback (for example, 30 days or more), the first run may take longer while historical reports are collected.
The report data stream collects bug bounty reports from HackerOne. Each report is stored as one document. When a report is updated, a new document is indexed with the latest information.
Exported fields
| Field | Description | Type |
|---|---|---|
| @timestamp | Event timestamp. | date |
| data_stream.dataset | Data stream dataset. | constant_keyword |
| data_stream.namespace | Data stream namespace. | constant_keyword |
| data_stream.type | Data stream type. | constant_keyword |
| ecs.version | ECS version this event conforms to. ecs.version is a required field and must exist in all events. When querying across multiple indices -- which may conform to slightly different ECS versions -- this field lets integrations adjust to the schema version of the events. |
keyword |
| error.message | Error message. | match_only_text |
| event.action | The action captured by the event. This describes the information in the event. It is more specific than event.category. Examples are group-add, process-started, file-created. The value is normally defined by the implementer. |
keyword |
| event.category | This is one of four ECS Categorization Fields, and indicates the second level in the ECS category hierarchy. event.category represents the "big buckets" of ECS categories. For example, filtering on event.category:process yields all events relating to process activity. This field is closely related to event.type, which is used as a subcategory. This field is an array. This will allow proper categorization of some events that fall in multiple categories. |
keyword |
| event.created | event.created contains the date/time when the event was first read by an agent, or by your pipeline. This field is distinct from @timestamp in that @timestamp typically contain the time extracted from the original event. In most situations, these two timestamps will be slightly different. The difference can be used to calculate the delay between your source generating an event, and the time when your agent first processed it. This can be used to monitor your agent's or pipeline's ability to keep up with your event source. In case the two timestamps are identical, @timestamp should be used. |
date |
| event.dataset | Event dataset. | constant_keyword |
| event.end | event.end contains the date when the event ended or when the activity was last observed. |
date |
| event.id | Unique ID to describe the event. | keyword |
| event.kind | This is one of four ECS Categorization Fields, and indicates the highest level in the ECS category hierarchy. event.kind gives high-level information about what type of information the event contains, without being specific to the contents of the event. For example, values of this field distinguish alert events from metric events. The value of this field can be used to inform how these kinds of events should be handled. They may warrant different retention, different access control, it may also help understand whether the data is coming in at a regular interval or not. |
keyword |
| event.module | Event module. | constant_keyword |
| event.original | Raw text message of entire event. Used to demonstrate log integrity or where the full log message (before splitting it up in multiple parts) may be required, e.g. for reindex. This field is not indexed and doc_values are disabled. It cannot be searched, but it can be retrieved from _source. If users wish to override this and index this field, please see Field data types in the Elasticsearch Reference. |
keyword |
| event.outcome | This is one of four ECS Categorization Fields, and indicates the lowest level in the ECS category hierarchy. event.outcome simply denotes whether the event represents a success or a failure from the perspective of the entity that produced the event. Note that when a single transaction is described in multiple events, each event may populate different values of event.outcome, according to their perspective. Also note that in the case of a compound event (a single event that contains multiple logical events), this field should be populated with the value that best captures the overall success or failure from the perspective of the event producer. Further note that not all events will have an associated outcome. For example, this field is generally not populated for metric events, events with event.type:info, or any events for which an outcome does not make logical sense. |
keyword |
| event.start | event.start contains the date when the event started or when the activity was first observed. |
date |
| event.type | This is one of four ECS Categorization Fields, and indicates the third level in the ECS category hierarchy. event.type represents a categorization "sub-bucket" that, when used along with the event.category field values, enables filtering events down to a level appropriate for single visualization. This field is an array. This will allow proper categorization of some events that fall in multiple event types. |
keyword |
| event.url | URL linking to an external system to continue investigation of this event. This URL links to another system where in-depth investigation of the specific occurrence of this event can take place. Alert events, indicated by event.kind:alert, are a common use case for this field. |
keyword |
| hackerone.report.attributes.bounty_awarded_at | Timestamp when a bounty award was recorded. | date |
| hackerone.report.attributes.closed_at | date | |
| hackerone.report.attributes.created_at | Report creation time from attributes. | date |
| hackerone.report.attributes.cve_ids | Full CVE identifiers when present beyond the ECS vulnerability.id primary. | keyword |
| hackerone.report.attributes.disclosed_at | Public disclosure timestamp. | date |
| hackerone.report.attributes.first_program_activity_at | First program-side activity time. | date |
| hackerone.report.attributes.hai_is_priority | boolean | |
| hackerone.report.attributes.hai_is_priority_reason | keyword | |
| hackerone.report.attributes.issue_tracker_reference_id | keyword | |
| hackerone.report.attributes.issue_tracker_reference_url | keyword | |
| hackerone.report.attributes.last_activity_at | Last activity time on the report (primary polling cursor). | date |
| hackerone.report.attributes.last_program_activity_at | Last program activity time. | date |
| hackerone.report.attributes.last_public_activity_at | Last public activity time. | date |
| hackerone.report.attributes.last_reporter_activity_at | Last reporter activity time. | date |
| hackerone.report.attributes.main_state | High-level workflow state (draft/open/closed). | keyword |
| hackerone.report.attributes.original_report_id | keyword | |
| hackerone.report.attributes.reporter_agreed_on_going_public_at | When the researcher agreed to going public. | date |
| hackerone.report.attributes.source | Source label for the submission when present. | keyword |
| hackerone.report.attributes.state | Operational report state consumed for ECS categorization. | keyword |
| hackerone.report.attributes.submitted_at | Submission acceptance time when present. | date |
| hackerone.report.attributes.swag_awarded_at | Timestamp when swag was recorded as awarded. | date |
| hackerone.report.attributes.timer_bounty_awarded_elapsed_time | long | |
| hackerone.report.attributes.timer_bounty_awarded_miss_at | date | |
| hackerone.report.attributes.timer_first_program_response_elapsed_time | long | |
| hackerone.report.attributes.timer_first_program_response_miss_at | date | |
| hackerone.report.attributes.timer_report_resolved_elapsed_time | long | |
| hackerone.report.attributes.timer_report_resolved_miss_at | date | |
| hackerone.report.attributes.timer_report_triage_elapsed_time | long | |
| hackerone.report.attributes.timer_report_triage_miss_at | date | |
| hackerone.report.attributes.title | Report title stored alongside ECS message. | keyword |
| hackerone.report.attributes.triaged_at | date | |
| hackerone.report.attributes.vulnerability_information | Raw Markdown narrative from the reporter submission. | match_only_text |
| hackerone.report.id | JSON:API resource identifier for the report. | keyword |
| hackerone.report.relationships.activities.data.attributes.bonus_amount | keyword | |
| hackerone.report.relationships.activities.data.attributes.bounty_amount | keyword | |
| hackerone.report.relationships.activities.data.attributes.created_at | date | |
| hackerone.report.relationships.activities.data.attributes.internal | boolean | |
| hackerone.report.relationships.activities.data.attributes.message | match_only_text | |
| hackerone.report.relationships.activities.data.attributes.report_id | keyword | |
| hackerone.report.relationships.activities.data.attributes.updated_at | date | |
| hackerone.report.relationships.activities.data.id | keyword | |
| hackerone.report.relationships.activities.data.relationships.actor.data.attributes.created_at | date | |
| hackerone.report.relationships.activities.data.relationships.actor.data.attributes.disabled | Whether the HackerOne user account is deactivated. | boolean |
| hackerone.report.relationships.activities.data.relationships.actor.data.attributes.name | keyword | |
| hackerone.report.relationships.activities.data.relationships.actor.data.attributes.username | keyword | |
| hackerone.report.relationships.activities.data.relationships.actor.data.id | keyword | |
| hackerone.report.relationships.activities.data.relationships.actor.data.type | keyword | |
| hackerone.report.relationships.activities.data.relationships.attachments.data.attributes.content_type | keyword | |
| hackerone.report.relationships.activities.data.relationships.attachments.data.attributes.created_at | date | |
| hackerone.report.relationships.activities.data.relationships.attachments.data.attributes.expiring_url | keyword | |
| hackerone.report.relationships.activities.data.relationships.attachments.data.attributes.file_name | keyword | |
| hackerone.report.relationships.activities.data.relationships.attachments.data.attributes.file_size | long | |
| hackerone.report.relationships.activities.data.relationships.attachments.data.id | keyword | |
| hackerone.report.relationships.activities.data.relationships.attachments.data.type | keyword | |
| hackerone.report.relationships.activities.data.type | keyword | |
| hackerone.report.relationships.assignee.data.attributes.created_at | date | |
| hackerone.report.relationships.assignee.data.attributes.name | keyword | |
| hackerone.report.relationships.assignee.data.attributes.permissions | keyword | |
| hackerone.report.relationships.assignee.data.attributes.username | keyword | |
| hackerone.report.relationships.assignee.data.id | keyword | |
| hackerone.report.relationships.assignee.data.type | Assignee discriminator (user/group). | keyword |
| hackerone.report.relationships.attachments.data.attributes.content_type | keyword | |
| hackerone.report.relationships.attachments.data.attributes.created_at | date | |
| hackerone.report.relationships.attachments.data.attributes.expiring_url | keyword | |
| hackerone.report.relationships.attachments.data.attributes.file_name | keyword | |
| hackerone.report.relationships.attachments.data.attributes.file_size | long | |
| hackerone.report.relationships.attachments.data.id | keyword | |
| hackerone.report.relationships.attachments.data.type | keyword | |
| hackerone.report.relationships.automated_remediation_guidance.data.attributes.created_at | date | |
| hackerone.report.relationships.automated_remediation_guidance.data.attributes.reference | keyword | |
| hackerone.report.relationships.automated_remediation_guidance.data.id | keyword | |
| hackerone.report.relationships.automated_remediation_guidance.data.type | keyword | |
| hackerone.report.relationships.bounties.data.attributes.amount | double | |
| hackerone.report.relationships.bounties.data.attributes.awarded_amount | double | |
| hackerone.report.relationships.bounties.data.attributes.awarded_bonus_amount | double | |
| hackerone.report.relationships.bounties.data.attributes.awarded_currency | keyword | |
| hackerone.report.relationships.bounties.data.attributes.bonus_amount | double | |
| hackerone.report.relationships.bounties.data.attributes.created_at | date | |
| hackerone.report.relationships.bounties.data.id | keyword | |
| hackerone.report.relationships.bounties.data.type | keyword | |
| hackerone.report.relationships.campaign.data.attributes.bounty_pool_limit | double | |
| hackerone.report.relationships.campaign.data.attributes.bounty_spent | double | |
| hackerone.report.relationships.campaign.data.attributes.campaign_type | keyword | |
| hackerone.report.relationships.campaign.data.attributes.critical | double | |
| hackerone.report.relationships.campaign.data.attributes.end_date | date | |
| hackerone.report.relationships.campaign.data.attributes.extended_at | date | |
| hackerone.report.relationships.campaign.data.attributes.high | double | |
| hackerone.report.relationships.campaign.data.attributes.low | double | |
| hackerone.report.relationships.campaign.data.attributes.medium | double | |
| hackerone.report.relationships.campaign.data.attributes.researchers_information | match_only_text | |
| hackerone.report.relationships.campaign.data.attributes.start_date | date | |
| hackerone.report.relationships.campaign.data.attributes.status | keyword | |
| hackerone.report.relationships.campaign.data.attributes.target_audience | boolean | |
| hackerone.report.relationships.campaign.data.attributes.total_critical_reports | long | |
| hackerone.report.relationships.campaign.data.attributes.total_high_reports | long | |
| hackerone.report.relationships.campaign.data.attributes.total_reports | long | |
| hackerone.report.relationships.campaign.data.attributes.valid_reports | long | |
| hackerone.report.relationships.campaign.data.id | keyword | |
| hackerone.report.relationships.campaign.data.type | keyword | |
| hackerone.report.relationships.collaborators.data.user.attributes.created_at | date | |
| hackerone.report.relationships.collaborators.data.user.attributes.disabled | Whether the HackerOne user account is deactivated. | boolean |
| hackerone.report.relationships.collaborators.data.user.attributes.name | keyword | |
| hackerone.report.relationships.collaborators.data.user.attributes.username | keyword | |
| hackerone.report.relationships.collaborators.data.user.id | keyword | |
| hackerone.report.relationships.collaborators.data.user.type | keyword | |
| hackerone.report.relationships.collaborators.data.weight | long | |
| hackerone.report.relationships.custom_field_values.data.attributes.field_value | keyword | |
| hackerone.report.relationships.custom_field_values.data.attributes.label | keyword | |
| hackerone.report.relationships.custom_field_values.data.attributes.value | keyword | |
| hackerone.report.relationships.custom_field_values.data.id | keyword | |
| hackerone.report.relationships.custom_field_values.data.type | keyword | |
| hackerone.report.relationships.custom_remediation_guidance.data.attributes.created_at | date | |
| hackerone.report.relationships.custom_remediation_guidance.data.attributes.message | match_only_text | |
| hackerone.report.relationships.custom_remediation_guidance.data.id | keyword | |
| hackerone.report.relationships.custom_remediation_guidance.data.relationships.author.data.attributes.created_at | date | |
| hackerone.report.relationships.custom_remediation_guidance.data.relationships.author.data.attributes.disabled | Whether the HackerOne user account is deactivated. | boolean |
| hackerone.report.relationships.custom_remediation_guidance.data.relationships.author.data.attributes.name | keyword | |
| hackerone.report.relationships.custom_remediation_guidance.data.relationships.author.data.attributes.username | keyword | |
| hackerone.report.relationships.custom_remediation_guidance.data.relationships.author.data.id | keyword | |
| hackerone.report.relationships.custom_remediation_guidance.data.relationships.author.data.type | keyword | |
| hackerone.report.relationships.custom_remediation_guidance.data.type | keyword | |
| hackerone.report.relationships.inboxes.data.attributes.name | keyword | |
| hackerone.report.relationships.inboxes.data.attributes.type | keyword | |
| hackerone.report.relationships.inboxes.data.id | keyword | |
| hackerone.report.relationships.inboxes.data.type | keyword | |
| hackerone.report.relationships.program.data.attributes.created_at | date | |
| hackerone.report.relationships.program.data.attributes.handle | keyword | |
| hackerone.report.relationships.program.data.attributes.updated_at | date | |
| hackerone.report.relationships.program.data.id | keyword | |
| hackerone.report.relationships.program.data.type | keyword | |
| hackerone.report.relationships.reporter.data.attributes.bio | match_only_text | |
| hackerone.report.relationships.reporter.data.attributes.created_at | date | |
| hackerone.report.relationships.reporter.data.attributes.disabled | Whether the HackerOne user account is deactivated. | boolean |
| hackerone.report.relationships.reporter.data.attributes.hackerone_triager | boolean | |
| hackerone.report.relationships.reporter.data.attributes.impact | double | |
| hackerone.report.relationships.reporter.data.attributes.location | keyword | |
| hackerone.report.relationships.reporter.data.attributes.name | keyword | |
| hackerone.report.relationships.reporter.data.attributes.reputation | long | |
| hackerone.report.relationships.reporter.data.attributes.signal | double | |
| hackerone.report.relationships.reporter.data.attributes.username | keyword | |
| hackerone.report.relationships.reporter.data.attributes.website | keyword | |
| hackerone.report.relationships.reporter.data.id | keyword | |
| hackerone.report.relationships.reporter.data.type | JSON API reporter resource type discriminator (typically user). | keyword |
| hackerone.report.relationships.severity.data.attributes.attack_complexity | keyword | |
| hackerone.report.relationships.severity.data.attributes.attack_vector | keyword | |
| hackerone.report.relationships.severity.data.attributes.author_type | keyword | |
| hackerone.report.relationships.severity.data.attributes.availability | keyword | |
| hackerone.report.relationships.severity.data.attributes.calculation_method | keyword | |
| hackerone.report.relationships.severity.data.attributes.confidentiality | keyword | |
| hackerone.report.relationships.severity.data.attributes.created_at | date | |
| hackerone.report.relationships.severity.data.attributes.cvss_4_point_0_metrics.attack_complexity | keyword | |
| hackerone.report.relationships.severity.data.attributes.cvss_4_point_0_metrics.attack_requirements | keyword | |
| hackerone.report.relationships.severity.data.attributes.cvss_4_point_0_metrics.attack_vector | keyword | |
| hackerone.report.relationships.severity.data.attributes.cvss_4_point_0_metrics.privileges_required | keyword | |
| hackerone.report.relationships.severity.data.attributes.cvss_4_point_0_metrics.subsequent_availability | keyword | |
| hackerone.report.relationships.severity.data.attributes.cvss_4_point_0_metrics.subsequent_confidentiality | keyword | |
| hackerone.report.relationships.severity.data.attributes.cvss_4_point_0_metrics.subsequent_integrity | keyword | |
| hackerone.report.relationships.severity.data.attributes.cvss_4_point_0_metrics.user_interaction | keyword | |
| hackerone.report.relationships.severity.data.attributes.cvss_4_point_0_metrics.vulnerable_availability | keyword | |
| hackerone.report.relationships.severity.data.attributes.cvss_4_point_0_metrics.vulnerable_confidentiality | keyword | |
| hackerone.report.relationships.severity.data.attributes.cvss_4_point_0_metrics.vulnerable_integrity | keyword | |
| hackerone.report.relationships.severity.data.attributes.cvss_vector_string | keyword | |
| hackerone.report.relationships.severity.data.attributes.integrity | keyword | |
| hackerone.report.relationships.severity.data.attributes.max_severity | keyword | |
| hackerone.report.relationships.severity.data.attributes.privileges_required | keyword | |
| hackerone.report.relationships.severity.data.attributes.rating | keyword | |
| hackerone.report.relationships.severity.data.attributes.scope | keyword | |
| hackerone.report.relationships.severity.data.attributes.score | double | |
| hackerone.report.relationships.severity.data.attributes.user_id | long | |
| hackerone.report.relationships.severity.data.attributes.user_interaction | keyword | |
| hackerone.report.relationships.severity.data.id | keyword | |
| hackerone.report.relationships.severity.data.type | keyword | |
| hackerone.report.relationships.structured_scope.data.attributes.asset_identifier | keyword | |
| hackerone.report.relationships.structured_scope.data.attributes.asset_type | keyword | |
| hackerone.report.relationships.structured_scope.data.attributes.availability_requirement | keyword | |
| hackerone.report.relationships.structured_scope.data.attributes.confidentiality_requirement | keyword | |
| hackerone.report.relationships.structured_scope.data.attributes.created_at | date | |
| hackerone.report.relationships.structured_scope.data.attributes.eligible_for_bounty | boolean | |
| hackerone.report.relationships.structured_scope.data.attributes.eligible_for_submission | boolean | |
| hackerone.report.relationships.structured_scope.data.attributes.instruction | match_only_text | |
| hackerone.report.relationships.structured_scope.data.attributes.integrity_requirement | keyword | |
| hackerone.report.relationships.structured_scope.data.attributes.max_severity | keyword | |
| hackerone.report.relationships.structured_scope.data.attributes.reference | keyword | |
| hackerone.report.relationships.structured_scope.data.attributes.updated_at | date | |
| hackerone.report.relationships.structured_scope.data.id | keyword | |
| hackerone.report.relationships.structured_scope.data.type | keyword | |
| hackerone.report.relationships.summaries.data.attributes.category | keyword | |
| hackerone.report.relationships.summaries.data.attributes.content | match_only_text | |
| hackerone.report.relationships.summaries.data.attributes.created_at | date | |
| hackerone.report.relationships.summaries.data.attributes.updated_at | date | |
| hackerone.report.relationships.summaries.data.id | keyword | |
| hackerone.report.relationships.summaries.data.relationships.attachments.data.attributes.content_type | keyword | |
| hackerone.report.relationships.summaries.data.relationships.attachments.data.attributes.created_at | date | |
| hackerone.report.relationships.summaries.data.relationships.attachments.data.attributes.expiring_url | keyword | |
| hackerone.report.relationships.summaries.data.relationships.attachments.data.attributes.file_name | keyword | |
| hackerone.report.relationships.summaries.data.relationships.attachments.data.attributes.file_size | long | |
| hackerone.report.relationships.summaries.data.relationships.attachments.data.id | keyword | |
| hackerone.report.relationships.summaries.data.relationships.attachments.data.type | keyword | |
| hackerone.report.relationships.summaries.data.relationships.user.data.attributes.created_at | date | |
| hackerone.report.relationships.summaries.data.relationships.user.data.attributes.disabled | Whether the HackerOne user account is deactivated. | boolean |
| hackerone.report.relationships.summaries.data.relationships.user.data.attributes.name | keyword | |
| hackerone.report.relationships.summaries.data.relationships.user.data.attributes.username | keyword | |
| hackerone.report.relationships.summaries.data.relationships.user.data.id | keyword | |
| hackerone.report.relationships.summaries.data.relationships.user.data.type | keyword | |
| hackerone.report.relationships.summaries.data.type | keyword | |
| hackerone.report.relationships.swag.data.attributes.created_at | date | |
| hackerone.report.relationships.swag.data.attributes.sent | boolean | |
| hackerone.report.relationships.swag.data.id | keyword | |
| hackerone.report.relationships.swag.data.relationships.user.data.attributes.created_at | date | |
| hackerone.report.relationships.swag.data.relationships.user.data.attributes.disabled | Whether the HackerOne user account is deactivated. | boolean |
| hackerone.report.relationships.swag.data.relationships.user.data.attributes.name | keyword | |
| hackerone.report.relationships.swag.data.relationships.user.data.attributes.username | keyword | |
| hackerone.report.relationships.swag.data.relationships.user.data.id | keyword | |
| hackerone.report.relationships.swag.data.relationships.user.data.type | keyword | |
| hackerone.report.relationships.swag.data.type | keyword | |
| hackerone.report.relationships.weakness.data.attributes.created_at | date | |
| hackerone.report.relationships.weakness.data.attributes.description | match_only_text | |
| hackerone.report.relationships.weakness.data.attributes.external_id | keyword | |
| hackerone.report.relationships.weakness.data.attributes.name | keyword | |
| hackerone.report.relationships.weakness.data.id | keyword | |
| hackerone.report.relationships.weakness.data.type | keyword | |
| hackerone.report.type | JSON:API resource type discriminator (typically report). |
keyword |
| input.type | Type of Filebeat input. | keyword |
| message | For log events the message field contains the log message, optimized for viewing in a log viewer. For structured logs without an original message field, other fields can be concatenated to form a human-readable summary of the event. If multiple messages exist, they can be combined into one message. | match_only_text |
| observer.product | The product name of the observer. | keyword |
| observer.vendor | Vendor name of the observer. | keyword |
| organization.id | Unique identifier for the organization. | keyword |
| organization.name | Organization name. | keyword |
| organization.name.text | Multi-field of organization.name. |
match_only_text |
| related.hosts | All hostnames or other host identifiers seen on your event. Example identifiers include FQDNs, domain names, workstation names, or aliases. | keyword |
| related.user | All the user names or other user identifiers seen on the event. | keyword |
| tags | List of keywords used to tag each event. | keyword |
| url.original | Unmodified original url as seen in the event source. Note that in network monitoring, the observed URL may be a full URL, whereas in access logs, the URL is often just represented as a path. This field is meant to represent the URL as it was observed, complete or not. | wildcard |
| url.original.text | Multi-field of url.original. |
match_only_text |
| user.full_name | User's full name, if available. | keyword |
| user.full_name.text | Multi-field of user.full_name. |
match_only_text |
| user.id | Unique identifier of the user. | keyword |
| user.name | Short name or login of the user. | keyword |
| user.name.text | Multi-field of user.name. |
match_only_text |
| vulnerability.classification | The classification of the vulnerability scoring system. For example (https://www.first.org/cvss/) | keyword |
| vulnerability.description | The description of the vulnerability that provides additional context of the vulnerability. For example (https://cve.mitre.org/about/faqs.html#cve_entry_descriptions_created) | keyword |
| vulnerability.description.text | Multi-field of vulnerability.description. |
match_only_text |
| vulnerability.enumeration | The type of identifier used for this vulnerability. For example (https://cve.mitre.org/about/) | keyword |
| vulnerability.id | The identification (ID) is the number portion of a vulnerability entry. It includes a unique identification number for the vulnerability. For example (https://cve.mitre.org/about/faqs.html#what_is_cve_id) | keyword |
| vulnerability.reference | A resource that provides additional information, context, and mitigations for the identified vulnerability. | keyword |
| vulnerability.report_id | The report or scan identification number. | keyword |
| vulnerability.scanner.vendor | The name of the vulnerability scanner vendor. | keyword |
| vulnerability.score.base | Scores can range from 0.0 to 10.0, with 10.0 being the most severe. Base scores cover an assessment for exploitability metrics (attack vector, complexity, privileges, and user interaction), impact metrics (confidentiality, integrity, and availability), and scope. For example (https://www.first.org/cvss/specification-document) | float |
| vulnerability.score.version | The National Vulnerability Database (NVD) provides qualitative severity rankings of "Low", "Medium", and "High" for CVSS v2.0 base score ranges in addition to the severity ratings for CVSS v3.0 as they are defined in the CVSS v3.0 specification. CVSS is owned and managed by FIRST.Org, Inc. (FIRST), a US-based non-profit organization, whose mission is to help computer security incident response teams across the world. For example (https://nvd.nist.gov/vuln-metrics/cvss) | keyword |
| vulnerability.severity | The severity of the vulnerability can help with metrics and internal prioritization regarding remediation. For example (https://nvd.nist.gov/vuln-metrics/cvss) | keyword |
Example
{
    "@timestamp": "2026-05-06T15:00:00.000Z",
    "agent": {
        "ephemeral_id": "a7695a43-0306-48e8-914a-e238120f982e",
        "id": "fe486f40-745b-4d48-bf94-82c6afffb697",
        "name": "elastic-agent-10839",
        "type": "filebeat",
        "version": "9.4.1"
    },
    "data_stream": {
        "dataset": "hackerone.report",
        "namespace": "51555",
        "type": "logs"
    },
    "ecs": {
        "version": "9.3.0"
    },
    "elastic_agent": {
        "id": "fe486f40-745b-4d48-bf94-82c6afffb697",
        "snapshot": false,
        "version": "9.4.1"
    },
    "event": {
        "action": "report-triaged",
        "agent_id_status": "verified",
        "category": [
            "vulnerability"
        ],
        "created": "2026-05-06T15:00:00.000Z",
        "dataset": "hackerone.report",
        "end": "2026-05-06T15:00:00.000Z",
        "id": "1003",
        "ingested": "2026-05-25T09:09:22Z",
        "kind": "event",
        "module": "hackerone",
        "original": "{\"attributes\":{\"created_at\":\"2026-05-06T15:00:00.000Z\",\"cve_ids\":[],\"last_activity_at\":\"2026-05-06T15:00:00.000Z\",\"state\":\"triaged\",\"submitted_at\":\"2026-05-06T15:01:00.000Z\",\"title\":\"Second-page XSS example\",\"vulnerability_information\":\"Short stub description for tests.\"},\"id\":\"1003\",\"relationships\":{\"program\":{\"data\":{\"attributes\":{\"created_at\":\"2017-09-28T13:08:32.058Z\",\"handle\":\"acme\",\"updated_at\":\"2026-05-07T08:41:04.851Z\"},\"id\":\"9001\",\"type\":\"program\"}}},\"type\":\"report\"}",
        "outcome": "unknown",
        "start": "2026-05-06T15:00:00.000Z",
        "type": [
            "info"
        ],
        "url": "https://hackerone.com/reports/1003"
    },
    "hackerone": {
        "report": {
            "attributes": {
                "created_at": "2026-05-06T15:00:00.000Z",
                "last_activity_at": "2026-05-06T15:00:00.000Z",
                "state": "triaged",
                "submitted_at": "2026-05-06T15:01:00.000Z",
                "title": "Second-page XSS example"
            },
            "relationships": {
                "program": {
                    "data": {
                        "attributes": {
                            "created_at": "2017-09-28T13:08:32.058Z",
                            "updated_at": "2026-05-07T08:41:04.851Z"
                        },
                        "type": "program"
                    }
                }
            },
            "type": "report"
        }
    },
    "input": {
        "type": "cel"
    },
    "message": "Second-page XSS example",
    "observer": {
        "product": "HackerOne",
        "vendor": "HackerOne"
    },
    "organization": {
        "id": "9001",
        "name": "acme"
    },
    "tags": [
        "preserve_original_event",
        "forwarded",
        "hackerone-report"
    ],
    "vulnerability": {
        "description": "Short stub description for tests.",
        "reference": "https://hackerone.com/reports/1003",
        "report_id": "1003",
        "scanner": {
            "vendor": "HackerOne"
        }
    }
}
- Description: Latest Reports from HackerOne. As reports get updated, this transform stores only the latest state of each report inside the destination index. The transform's destination index contains only the latest state of the report.
- Source Index: logs-hackerone.report-*
- Destination Index: logs-hackerone_latest.dest_report-v3
Exported fields
| Field | Description | Type |
|---|---|---|
| @timestamp | Event timestamp. | date |
| data_stream.dataset | Data stream dataset. | constant_keyword |
| data_stream.namespace | Data stream namespace. | constant_keyword |
| data_stream.type | Data stream type. | constant_keyword |
| ecs.version | ECS version this event conforms to. ecs.version is a required field and must exist in all events. When querying across multiple indices -- which may conform to slightly different ECS versions -- this field lets integrations adjust to the schema version of the events. |
keyword |
| error.message | Error message. | match_only_text |
| event.action | The action captured by the event. This describes the information in the event. It is more specific than event.category. Examples are group-add, process-started, file-created. The value is normally defined by the implementer. |
keyword |
| event.category | This is one of four ECS Categorization Fields, and indicates the second level in the ECS category hierarchy. event.category represents the "big buckets" of ECS categories. For example, filtering on event.category:process yields all events relating to process activity. This field is closely related to event.type, which is used as a subcategory. This field is an array. This will allow proper categorization of some events that fall in multiple categories. |
keyword |
| event.created | event.created contains the date/time when the event was first read by an agent, or by your pipeline. This field is distinct from @timestamp in that @timestamp typically contain the time extracted from the original event. In most situations, these two timestamps will be slightly different. The difference can be used to calculate the delay between your source generating an event, and the time when your agent first processed it. This can be used to monitor your agent's or pipeline's ability to keep up with your event source. In case the two timestamps are identical, @timestamp should be used. |
date |
| event.dataset | Event dataset. | constant_keyword |
| event.end | event.end contains the date when the event ended or when the activity was last observed. |
date |
| event.id | Unique ID to describe the event. | keyword |
| event.kind | This is one of four ECS Categorization Fields, and indicates the highest level in the ECS category hierarchy. event.kind gives high-level information about what type of information the event contains, without being specific to the contents of the event. For example, values of this field distinguish alert events from metric events. The value of this field can be used to inform how these kinds of events should be handled. They may warrant different retention, different access control, it may also help understand whether the data is coming in at a regular interval or not. |
keyword |
| event.module | Event module. | constant_keyword |
| event.original | Raw text message of entire event. Used to demonstrate log integrity or where the full log message (before splitting it up in multiple parts) may be required, e.g. for reindex. This field is not indexed and doc_values are disabled. It cannot be searched, but it can be retrieved from _source. If users wish to override this and index this field, please see Field data types in the Elasticsearch Reference. |
keyword |
| event.outcome | This is one of four ECS Categorization Fields, and indicates the lowest level in the ECS category hierarchy. event.outcome simply denotes whether the event represents a success or a failure from the perspective of the entity that produced the event. Note that when a single transaction is described in multiple events, each event may populate different values of event.outcome, according to their perspective. Also note that in the case of a compound event (a single event that contains multiple logical events), this field should be populated with the value that best captures the overall success or failure from the perspective of the event producer. Further note that not all events will have an associated outcome. For example, this field is generally not populated for metric events, events with event.type:info, or any events for which an outcome does not make logical sense. |
keyword |
| event.start | event.start contains the date when the event started or when the activity was first observed. |
date |
| event.type | This is one of four ECS Categorization Fields, and indicates the third level in the ECS category hierarchy. event.type represents a categorization "sub-bucket" that, when used along with the event.category field values, enables filtering events down to a level appropriate for single visualization. This field is an array. This will allow proper categorization of some events that fall in multiple event types. |
keyword |
| event.url | URL linking to an external system to continue investigation of this event. This URL links to another system where in-depth investigation of the specific occurrence of this event can take place. Alert events, indicated by event.kind:alert, are a common use case for this field. |
keyword |
| hackerone.report.attributes.bounty_awarded_at | Timestamp when a bounty award was recorded. | date |
| hackerone.report.attributes.closed_at | date | |
| hackerone.report.attributes.created_at | Report creation time mirrored from attributes. | date |
| hackerone.report.attributes.cve_ids | Full CVE identifiers when present beyond the ECS vulnerability.id primary. | keyword |
| hackerone.report.attributes.disclosed_at | Public disclosure timestamp. | date |
| hackerone.report.attributes.first_program_activity_at | First program-side activity time. | date |
| hackerone.report.attributes.hai_is_priority | boolean | |
| hackerone.report.attributes.hai_is_priority_reason | keyword | |
| hackerone.report.attributes.issue_tracker_reference_id | keyword | |
| hackerone.report.attributes.issue_tracker_reference_url | keyword | |
| hackerone.report.attributes.last_activity_at | Last activity time on the report (primary polling cursor). | date |
| hackerone.report.attributes.last_program_activity_at | Last program activity time. | date |
| hackerone.report.attributes.last_public_activity_at | Last public activity time. | date |
| hackerone.report.attributes.last_reporter_activity_at | Last reporter activity time. | date |
| hackerone.report.attributes.main_state | High-level workflow state (draft/open/closed). | keyword |
| hackerone.report.attributes.original_report_id | keyword | |
| hackerone.report.attributes.reporter_agreed_on_going_public_at | When the researcher agreed to going public. | date |
| hackerone.report.attributes.source | Source label for the submission when present. | keyword |
| hackerone.report.attributes.state | Operational report state consumed for ECS categorization. | keyword |
| hackerone.report.attributes.submitted_at | Submission acceptance time when present. | date |
| hackerone.report.attributes.swag_awarded_at | Timestamp when swag was recorded as awarded. | date |
| hackerone.report.attributes.timer_bounty_awarded_elapsed_time | long | |
| hackerone.report.attributes.timer_bounty_awarded_miss_at | date | |
| hackerone.report.attributes.timer_first_program_response_elapsed_time | long | |
| hackerone.report.attributes.timer_first_program_response_miss_at | date | |
| hackerone.report.attributes.timer_report_resolved_elapsed_time | long | |
| hackerone.report.attributes.timer_report_resolved_miss_at | date | |
| hackerone.report.attributes.timer_report_triage_elapsed_time | long | |
| hackerone.report.attributes.timer_report_triage_miss_at | date | |
| hackerone.report.attributes.title | Report title. Also copied to ECS message. |
keyword |
| hackerone.report.attributes.triaged_at | date | |
| hackerone.report.attributes.vulnerability_information | Raw Markdown narrative mirrored from the reporter submission. | match_only_text |
| hackerone.report.id | JSON:API resource identifier for the report. | keyword |
| hackerone.report.relationships.activities.data.attributes.bonus_amount | keyword | |
| hackerone.report.relationships.activities.data.attributes.bounty_amount | keyword | |
| hackerone.report.relationships.activities.data.attributes.created_at | date | |
| hackerone.report.relationships.activities.data.attributes.internal | boolean | |
| hackerone.report.relationships.activities.data.attributes.message | match_only_text | |
| hackerone.report.relationships.activities.data.attributes.report_id | keyword | |
| hackerone.report.relationships.activities.data.attributes.updated_at | date | |
| hackerone.report.relationships.activities.data.id | keyword | |
| hackerone.report.relationships.activities.data.relationships.actor.data.attributes.created_at | date | |
| hackerone.report.relationships.activities.data.relationships.actor.data.attributes.disabled | boolean | |
| hackerone.report.relationships.activities.data.relationships.actor.data.attributes.name | keyword | |
| hackerone.report.relationships.activities.data.relationships.actor.data.attributes.username | keyword | |
| hackerone.report.relationships.activities.data.relationships.actor.data.id | keyword | |
| hackerone.report.relationships.activities.data.relationships.actor.data.type | keyword | |
| hackerone.report.relationships.activities.data.relationships.attachments.data.attributes.content_type | keyword | |
| hackerone.report.relationships.activities.data.relationships.attachments.data.attributes.created_at | date | |
| hackerone.report.relationships.activities.data.relationships.attachments.data.attributes.expiring_url | keyword | |
| hackerone.report.relationships.activities.data.relationships.attachments.data.attributes.file_name | keyword | |
| hackerone.report.relationships.activities.data.relationships.attachments.data.attributes.file_size | long | |
| hackerone.report.relationships.activities.data.relationships.attachments.data.id | keyword | |
| hackerone.report.relationships.activities.data.relationships.attachments.data.type | keyword | |
| hackerone.report.relationships.activities.data.type | keyword | |
| hackerone.report.relationships.assignee.data.attributes.created_at | date | |
| hackerone.report.relationships.assignee.data.attributes.name | keyword | |
| hackerone.report.relationships.assignee.data.attributes.permissions | keyword | |
| hackerone.report.relationships.assignee.data.attributes.username | keyword | |
| hackerone.report.relationships.assignee.data.id | keyword | |
| hackerone.report.relationships.assignee.data.type | Assignee discriminator (user/group). | keyword |
| hackerone.report.relationships.attachments.data.attributes.content_type | keyword | |
| hackerone.report.relationships.attachments.data.attributes.created_at | date | |
| hackerone.report.relationships.attachments.data.attributes.expiring_url | keyword | |
| hackerone.report.relationships.attachments.data.attributes.file_name | keyword | |
| hackerone.report.relationships.attachments.data.attributes.file_size | long | |
| hackerone.report.relationships.attachments.data.id | keyword | |
| hackerone.report.relationships.attachments.data.type | keyword | |
| hackerone.report.relationships.automated_remediation_guidance.data.attributes.created_at | date | |
| hackerone.report.relationships.automated_remediation_guidance.data.attributes.reference | keyword | |
| hackerone.report.relationships.automated_remediation_guidance.data.id | keyword | |
| hackerone.report.relationships.automated_remediation_guidance.data.type | keyword | |
| hackerone.report.relationships.bounties.data.attributes.amount | double | |
| hackerone.report.relationships.bounties.data.attributes.awarded_amount | double | |
| hackerone.report.relationships.bounties.data.attributes.awarded_bonus_amount | double | |
| hackerone.report.relationships.bounties.data.attributes.awarded_currency | keyword | |
| hackerone.report.relationships.bounties.data.attributes.bonus_amount | double | |
| hackerone.report.relationships.bounties.data.attributes.created_at | date | |
| hackerone.report.relationships.bounties.data.id | keyword | |
| hackerone.report.relationships.bounties.data.type | keyword | |
| hackerone.report.relationships.campaign.data.attributes.bounty_pool_limit | double | |
| hackerone.report.relationships.campaign.data.attributes.bounty_spent | double | |
| hackerone.report.relationships.campaign.data.attributes.campaign_type | keyword | |
| hackerone.report.relationships.campaign.data.attributes.critical | double | |
| hackerone.report.relationships.campaign.data.attributes.end_date | date | |
| hackerone.report.relationships.campaign.data.attributes.extended_at | date | |
| hackerone.report.relationships.campaign.data.attributes.high | double | |
| hackerone.report.relationships.campaign.data.attributes.low | double | |
| hackerone.report.relationships.campaign.data.attributes.medium | double | |
| hackerone.report.relationships.campaign.data.attributes.researchers_information | match_only_text | |
| hackerone.report.relationships.campaign.data.attributes.start_date | date | |
| hackerone.report.relationships.campaign.data.attributes.status | keyword | |
| hackerone.report.relationships.campaign.data.attributes.target_audience | boolean | |
| hackerone.report.relationships.campaign.data.attributes.total_critical_reports | long | |
| hackerone.report.relationships.campaign.data.attributes.total_high_reports | long | |
| hackerone.report.relationships.campaign.data.attributes.total_reports | long | |
| hackerone.report.relationships.campaign.data.attributes.valid_reports | long | |
| hackerone.report.relationships.campaign.data.id | keyword | |
| hackerone.report.relationships.campaign.data.type | keyword | |
| hackerone.report.relationships.collaborators.data.user.attributes.created_at | date | |
| hackerone.report.relationships.collaborators.data.user.attributes.disabled | boolean | |
| hackerone.report.relationships.collaborators.data.user.attributes.name | keyword | |
| hackerone.report.relationships.collaborators.data.user.attributes.username | keyword | |
| hackerone.report.relationships.collaborators.data.user.id | keyword | |
| hackerone.report.relationships.collaborators.data.user.type | keyword | |
| hackerone.report.relationships.collaborators.data.weight | long | |
| hackerone.report.relationships.custom_field_values.data.attributes.field_value | keyword | |
| hackerone.report.relationships.custom_field_values.data.attributes.label | keyword | |
| hackerone.report.relationships.custom_field_values.data.attributes.value | keyword | |
| hackerone.report.relationships.custom_field_values.data.id | keyword | |
| hackerone.report.relationships.custom_field_values.data.type | keyword | |
| hackerone.report.relationships.custom_remediation_guidance.data.attributes.created_at | date | |
| hackerone.report.relationships.custom_remediation_guidance.data.attributes.message | match_only_text | |
| hackerone.report.relationships.custom_remediation_guidance.data.id | keyword | |
| hackerone.report.relationships.custom_remediation_guidance.data.relationships.author.data.attributes.created_at | date | |
| hackerone.report.relationships.custom_remediation_guidance.data.relationships.author.data.attributes.disabled | boolean | |
| hackerone.report.relationships.custom_remediation_guidance.data.relationships.author.data.attributes.name | keyword | |
| hackerone.report.relationships.custom_remediation_guidance.data.relationships.author.data.attributes.username | keyword | |
| hackerone.report.relationships.custom_remediation_guidance.data.relationships.author.data.id | keyword | |
| hackerone.report.relationships.custom_remediation_guidance.data.relationships.author.data.type | keyword | |
| hackerone.report.relationships.custom_remediation_guidance.data.type | keyword | |
| hackerone.report.relationships.inboxes.data.attributes.name | keyword | |
| hackerone.report.relationships.inboxes.data.attributes.type | keyword | |
| hackerone.report.relationships.inboxes.data.id | keyword | |
| hackerone.report.relationships.inboxes.data.type | keyword | |
| hackerone.report.relationships.program.data.attributes.created_at | date | |
| hackerone.report.relationships.program.data.attributes.handle | keyword | |
| hackerone.report.relationships.program.data.attributes.updated_at | date | |
| hackerone.report.relationships.program.data.id | keyword | |
| hackerone.report.relationships.program.data.type | keyword | |
| hackerone.report.relationships.reporter.data.attributes.bio | match_only_text | |
| hackerone.report.relationships.reporter.data.attributes.created_at | date | |
| hackerone.report.relationships.reporter.data.attributes.disabled | boolean | |
| hackerone.report.relationships.reporter.data.attributes.hackerone_triager | boolean | |
| hackerone.report.relationships.reporter.data.attributes.impact | double | |
| hackerone.report.relationships.reporter.data.attributes.location | keyword | |
| hackerone.report.relationships.reporter.data.attributes.name | keyword | |
| hackerone.report.relationships.reporter.data.attributes.reputation | long | |
| hackerone.report.relationships.reporter.data.attributes.signal | double | |
| hackerone.report.relationships.reporter.data.attributes.username | keyword | |
| hackerone.report.relationships.reporter.data.attributes.website | keyword | |
| hackerone.report.relationships.reporter.data.id | keyword | |
| hackerone.report.relationships.reporter.data.type | JSON API reporter resource type discriminator (typically user). | keyword |
| hackerone.report.relationships.severity.data.attributes.attack_complexity | keyword | |
| hackerone.report.relationships.severity.data.attributes.attack_vector | keyword | |
| hackerone.report.relationships.severity.data.attributes.author_type | keyword | |
| hackerone.report.relationships.severity.data.attributes.availability | keyword | |
| hackerone.report.relationships.severity.data.attributes.calculation_method | keyword | |
| hackerone.report.relationships.severity.data.attributes.confidentiality | keyword | |
| hackerone.report.relationships.severity.data.attributes.created_at | date | |
| hackerone.report.relationships.severity.data.attributes.cvss_4_point_0_metrics.attack_complexity | keyword | |
| hackerone.report.relationships.severity.data.attributes.cvss_4_point_0_metrics.attack_requirements | keyword | |
| hackerone.report.relationships.severity.data.attributes.cvss_4_point_0_metrics.attack_vector | keyword | |
| hackerone.report.relationships.severity.data.attributes.cvss_4_point_0_metrics.privileges_required | keyword | |
| hackerone.report.relationships.severity.data.attributes.cvss_4_point_0_metrics.subsequent_availability | keyword | |
| hackerone.report.relationships.severity.data.attributes.cvss_4_point_0_metrics.subsequent_confidentiality | keyword | |
| hackerone.report.relationships.severity.data.attributes.cvss_4_point_0_metrics.subsequent_integrity | keyword | |
| hackerone.report.relationships.severity.data.attributes.cvss_4_point_0_metrics.user_interaction | keyword | |
| hackerone.report.relationships.severity.data.attributes.cvss_4_point_0_metrics.vulnerable_availability | keyword | |
| hackerone.report.relationships.severity.data.attributes.cvss_4_point_0_metrics.vulnerable_confidentiality | keyword | |
| hackerone.report.relationships.severity.data.attributes.cvss_4_point_0_metrics.vulnerable_integrity | keyword | |
| hackerone.report.relationships.severity.data.attributes.cvss_vector_string | keyword | |
| hackerone.report.relationships.severity.data.attributes.integrity | keyword | |
| hackerone.report.relationships.severity.data.attributes.max_severity | keyword | |
| hackerone.report.relationships.severity.data.attributes.privileges_required | keyword | |
| hackerone.report.relationships.severity.data.attributes.rating | keyword | |
| hackerone.report.relationships.severity.data.attributes.scope | keyword | |
| hackerone.report.relationships.severity.data.attributes.score | double | |
| hackerone.report.relationships.severity.data.attributes.user_id | long | |
| hackerone.report.relationships.severity.data.attributes.user_interaction | keyword | |
| hackerone.report.relationships.severity.data.id | keyword | |
| hackerone.report.relationships.severity.data.type | keyword | |
| hackerone.report.relationships.structured_scope.data.attributes.asset_identifier | keyword | |
| hackerone.report.relationships.structured_scope.data.attributes.asset_type | keyword | |
| hackerone.report.relationships.structured_scope.data.attributes.availability_requirement | keyword | |
| hackerone.report.relationships.structured_scope.data.attributes.confidentiality_requirement | keyword | |
| hackerone.report.relationships.structured_scope.data.attributes.created_at | date | |
| hackerone.report.relationships.structured_scope.data.attributes.eligible_for_bounty | boolean | |
| hackerone.report.relationships.structured_scope.data.attributes.eligible_for_submission | boolean | |
| hackerone.report.relationships.structured_scope.data.attributes.instruction | match_only_text | |
| hackerone.report.relationships.structured_scope.data.attributes.integrity_requirement | keyword | |
| hackerone.report.relationships.structured_scope.data.attributes.max_severity | keyword | |
| hackerone.report.relationships.structured_scope.data.attributes.reference | keyword | |
| hackerone.report.relationships.structured_scope.data.attributes.updated_at | date | |
| hackerone.report.relationships.structured_scope.data.id | keyword | |
| hackerone.report.relationships.structured_scope.data.type | keyword | |
| hackerone.report.relationships.summaries.data.attributes.category | keyword | |
| hackerone.report.relationships.summaries.data.attributes.content | match_only_text | |
| hackerone.report.relationships.summaries.data.attributes.created_at | date | |
| hackerone.report.relationships.summaries.data.attributes.updated_at | date | |
| hackerone.report.relationships.summaries.data.id | keyword | |
| hackerone.report.relationships.summaries.data.relationships.attachments.data.attributes.content_type | keyword | |
| hackerone.report.relationships.summaries.data.relationships.attachments.data.attributes.created_at | date | |
| hackerone.report.relationships.summaries.data.relationships.attachments.data.attributes.expiring_url | keyword | |
| hackerone.report.relationships.summaries.data.relationships.attachments.data.attributes.file_name | keyword | |
| hackerone.report.relationships.summaries.data.relationships.attachments.data.attributes.file_size | long | |
| hackerone.report.relationships.summaries.data.relationships.attachments.data.id | keyword | |
| hackerone.report.relationships.summaries.data.relationships.attachments.data.type | keyword | |
| hackerone.report.relationships.summaries.data.relationships.user.data.attributes.created_at | date | |
| hackerone.report.relationships.summaries.data.relationships.user.data.attributes.disabled | boolean | |
| hackerone.report.relationships.summaries.data.relationships.user.data.attributes.name | keyword | |
| hackerone.report.relationships.summaries.data.relationships.user.data.attributes.username | keyword | |
| hackerone.report.relationships.summaries.data.relationships.user.data.id | keyword | |
| hackerone.report.relationships.summaries.data.relationships.user.data.type | keyword | |
| hackerone.report.relationships.summaries.data.type | keyword | |
| hackerone.report.relationships.swag.data.attributes.created_at | date | |
| hackerone.report.relationships.swag.data.attributes.sent | boolean | |
| hackerone.report.relationships.swag.data.id | keyword | |
| hackerone.report.relationships.swag.data.relationships.user.data.attributes.created_at | date | |
| hackerone.report.relationships.swag.data.relationships.user.data.attributes.disabled | boolean | |
| hackerone.report.relationships.swag.data.relationships.user.data.attributes.name | keyword | |
| hackerone.report.relationships.swag.data.relationships.user.data.attributes.username | keyword | |
| hackerone.report.relationships.swag.data.relationships.user.data.id | keyword | |
| hackerone.report.relationships.swag.data.relationships.user.data.type | keyword | |
| hackerone.report.relationships.swag.data.type | keyword | |
| hackerone.report.relationships.weakness.data.attributes.created_at | date | |
| hackerone.report.relationships.weakness.data.attributes.description | match_only_text | |
| hackerone.report.relationships.weakness.data.attributes.external_id | keyword | |
| hackerone.report.relationships.weakness.data.attributes.name | keyword | |
| hackerone.report.relationships.weakness.data.id | keyword | |
| hackerone.report.relationships.weakness.data.type | keyword | |
| hackerone.report.type | JSON:API resource type discriminator (typically report). |
keyword |
| input.type | Type of Filebeat input. | keyword |
| labels.is_transform_source | Distinguishes between documents that are a source for a transform and documents that are an output of a transform, to facilitate easier filtering. | constant_keyword |
| message | For log events the message field contains the log message, optimized for viewing in a log viewer. For structured logs without an original message field, other fields can be concatenated to form a human-readable summary of the event. If multiple messages exist, they can be combined into one message. | match_only_text |
| observer.product | The product name of the observer. | constant_keyword |
| observer.vendor | Vendor name of the observer. | constant_keyword |
| organization.id | Unique identifier for the organization. | keyword |
| organization.name | Organization name. | keyword |
| organization.name.text | Multi-field of organization.name. |
match_only_text |
| related.hosts | All hostnames or other host identifiers seen on your event. Example identifiers include FQDNs, domain names, workstation names, or aliases. | keyword |
| related.user | All the user names or other user identifiers seen on the event. | keyword |
| tags | List of keywords used to tag each event. | keyword |
| url.original | Unmodified original url as seen in the event source. Note that in network monitoring, the observed URL may be a full URL, whereas in access logs, the URL is often just represented as a path. This field is meant to represent the URL as it was observed, complete or not. | wildcard |
| url.original.text | Multi-field of url.original. |
match_only_text |
| user.full_name | User's full name, if available. | keyword |
| user.full_name.text | Multi-field of user.full_name. |
match_only_text |
| user.id | Unique identifier of the user. | keyword |
| user.name | Short name or login of the user. | keyword |
| user.name.text | Multi-field of user.name. |
match_only_text |
| vulnerability.classification | The classification of the vulnerability scoring system. For example (https://www.first.org/cvss/) | keyword |
| vulnerability.description | The description of the vulnerability that provides additional context of the vulnerability. For example (https://cve.mitre.org/about/faqs.html#cve_entry_descriptions_created) | keyword |
| vulnerability.description.text | Multi-field of vulnerability.description. |
match_only_text |
| vulnerability.enumeration | The type of identifier used for this vulnerability. For example (https://cve.mitre.org/about/) | keyword |
| vulnerability.id | The identification (ID) is the number portion of a vulnerability entry. It includes a unique identification number for the vulnerability. For example (https://cve.mitre.org/about/faqs.html#what_is_cve_id) | keyword |
| vulnerability.reference | A resource that provides additional information, context, and mitigations for the identified vulnerability. | keyword |
| vulnerability.report_id | The report or scan identification number. | keyword |
| vulnerability.scanner.vendor | The name of the vulnerability scanner vendor. | constant_keyword |
| vulnerability.score.base | Scores can range from 0.0 to 10.0, with 10.0 being the most severe. Base scores cover an assessment for exploitability metrics (attack vector, complexity, privileges, and user interaction), impact metrics (confidentiality, integrity, and availability), and scope. For example (https://www.first.org/cvss/specification-document) | float |
| vulnerability.score.version | The National Vulnerability Database (NVD) provides qualitative severity rankings of "Low", "Medium", and "High" for CVSS v2.0 base score ranges in addition to the severity ratings for CVSS v3.0 as they are defined in the CVSS v3.0 specification. CVSS is owned and managed by FIRST.Org, Inc. (FIRST), a US-based non-profit organization, whose mission is to help computer security incident response teams across the world. For example (https://nvd.nist.gov/vuln-metrics/cvss) | keyword |
| vulnerability.severity | The severity of the vulnerability can help with metrics and internal prioritization regarding remediation. For example (https://nvd.nist.gov/vuln-metrics/cvss) | keyword |
These inputs can be used with this integration:
cel
For more details about the CEL input settings, check the Filebeat documentation.
Before configuring the CEL input, make sure you have:
- Network connectivity to the target API endpoint
- Valid authentication credentials (API keys, tokens, or certificates as required)
- Appropriate permissions to read from the target data source
To configure the CEL input, you must specify the request.url value pointing to the API endpoint. The interval parameter controls how frequently requests are made and is the primary way to balance data freshness with API rate limits and costs. Authentication is often configured through the request.headers section using the appropriate method for the service.
To access the API service, make sure you have the necessary API credentials and that the Filebeat instance can reach the endpoint URL. Some services may require IP whitelisting or VPN access.
To collect logs via API endpoint, configure the following parameters:
- API Endpoint URL
- API credentials (tokens, keys, or username/password)
- Request interval (how often to fetch data)
This integration uses the following HackerOne API endpoint:
- List reports — retrieves bug bounty reports for the programs or inboxes you configure.
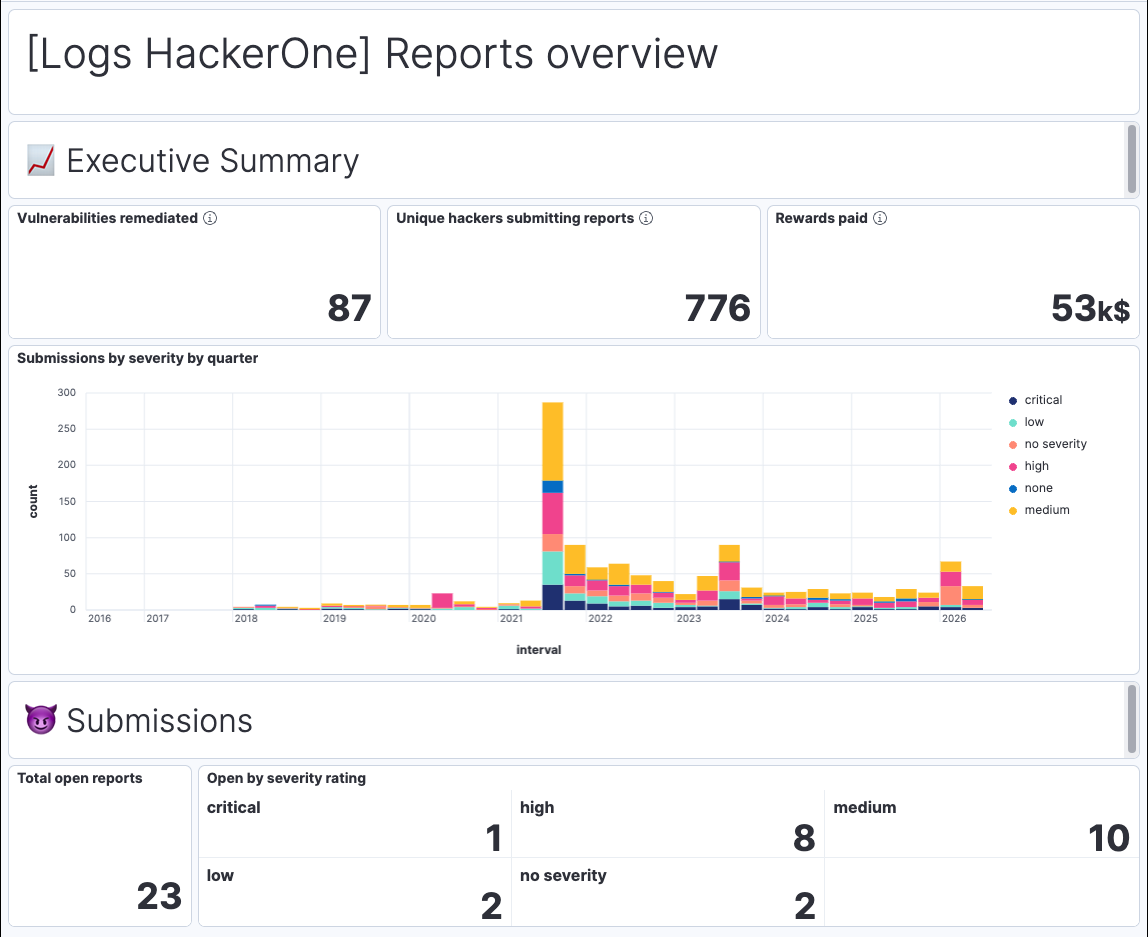
This integration includes one or more Kibana dashboards that visualizes the data collected by the integration. The screenshots below illustrate how the ingested data is displayed.
Changelog
| Version | Details | Minimum Kibana version |
|---|---|---|
| 0.3.0 | Bug fix (View pull request) Keep the full report body in hackerone.report.attributes.vulnerability_information and truncate vulnerability.description to 1024 characters so long bodies are no longer dropped into _ignored. Existing documents must be reindexed for this change to apply.Bug fix (View pull request) Include cold and frozen tiers in the latest-report transform source and rename the destination index to logs-hackerone_latest.dest_report-v3. The transform is reinstalled on upgrade and rebuilds the latest index from the source data. |
9.1.0 8.19.0 |
| 0.2.0 | Enhancement (View pull request) Configure the latest-report transform destination with lookup index mode so it can be used as the lookup index in ES|QL LOOKUP JOIN. Enhancement (View pull request) Scope the Reports overview dashboard to the hackerone.report dataset. |
9.1.0 8.19.0 |
| 0.1.1 | Bug fix (View pull request) Remove empty ILM policies section from the README. |
9.1.0 8.19.0 |
| 0.1.0 | Enhancement (View pull request) Initial release of the HackerOne integration with the report data stream. |
9.1.0 8.19.0 |