OpenTelemetry internal telemetry Assets
| Version | 0.0.1
|
| Subscription level What's this? |
Basic |
| Developed by What's this? |
Elastic |
| Minimum Kibana version(s) | 9.2.1 |
To use beta integrations, go to the Integrations page in Kibana, scroll down, and toggle on the Display beta integrations option.
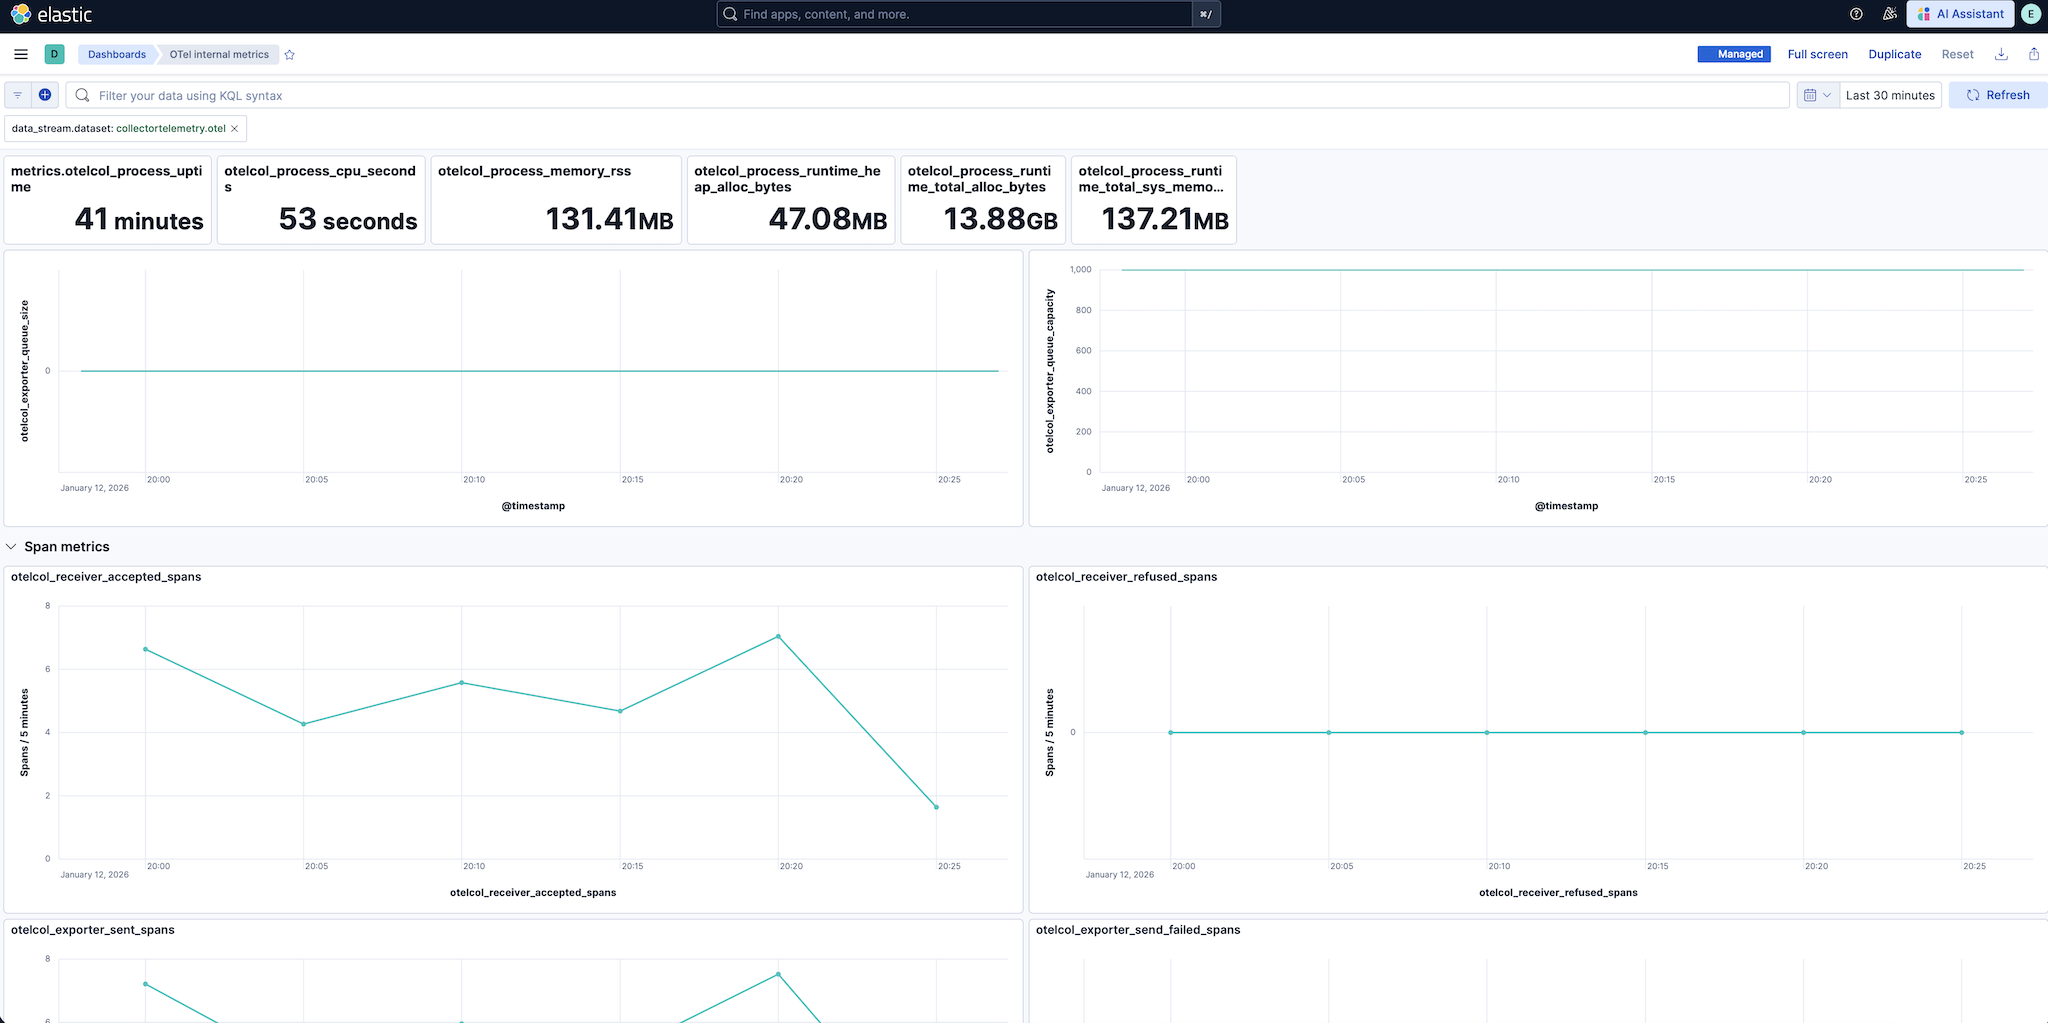
This package contains dashboards that visualize the internal metrics from OpenTelemetry components.
The OTel collector dashboards are compatible with the metrics defined here in the OpenTelemetry collector documentation. The oldest tested version of the OpenTelemetry Collector in combination with this package is v1.44.0.
The dashboards rely on field names defined in above documentation.
You need to follow the documentation of the OpenTelemetry collector to setup and send internal telemetry to your cluster.
An most important prerequisite is to define the telemetry section under service:
service:
  telemetry:
    metrics:
      readers:
        - periodic:
            exporter:
              otlp:
                protocol: http/protobuf
                endpoint: https://backend:4318
With this, you'll have internal telemetry on normal verbosity level.
For all the other config, refer to the upstream documentation.
This integration includes one or more Kibana dashboards that visualizes the data collected by the integration. The screenshots below illustrate how the ingested data is displayed.
Changelog
| Version | Details | Minimum Kibana version |
|---|---|---|
| 0.0.1 | Enhancement (View pull request) Adding visualizations for OpenTelemetry Collector internal telemetry including CPU, memory, usage, queue size, failed and exported spans, metrics, traces. |
— |
