Metricbeat quick start: installation and configuration
Metricbeat helps you monitor your servers and the services they host by collecting metrics from the operating system and services.
This guide describes how to get started quickly with metrics collection. You’ll learn how to:
- install Metricbeat on each system you want to monitor
- specify the metrics you want to collect
- send the metrics to {es}
- visualize the metrics data in {kib}
You need Elasticsearch for storing and searching your data, and Kibana for visualizing and managing it.
To get started quickly, spin up a deployment of our hosted Elasticsearch Service. The Elasticsearch Service is available on AWS, GCP, and Azure. Try it out for free.
To install and run Elasticsearch and Kibana, see Installing the Elastic Stack.
Install Metricbeat as close as possible to the service you want to monitor. For example, if you have four servers with MySQL running, it’s recommended that you run Metricbeat on each server. This allows Metricbeat to access your service from localhost and does not cause any additional network traffic or prevent Metricbeat from collecting metrics when there are network problems. Metrics from multiple Metricbeat instances will be combined on the Elasticsearch server.
To download and install Metricbeat, use the commands that work with your system:
Version 9.0.0-beta1 of Metricbeat has not yet been released.
Version 9.0.0-beta1 of Metricbeat has not yet been released.
Version 9.0.0-beta1 of Metricbeat has not yet been released.
Version 9.0.0-beta1 of Metricbeat has not yet been released.
Version 9.0.0-beta1 of Metricbeat has not yet been released.
The commands shown are for AMD platforms, but ARM packages are also available. Refer to the download page for the full list of available packages.
Connections to Elasticsearch and Kibana are required to set up Metricbeat.
Set the connection information in metricbeat.yml. To locate this configuration file, see Directory layout.
Specify the cloud.id of your Elasticsearch Service, and set cloud.auth to a user who is authorized to set up Metricbeat. For example:
cloud.id: "staging:dXMtZWFzdC0xLmF3cy5mb3VuZC5pbyRjZWM2ZjI2MWE3NGJmMjRjZTMzYmI4ODExYjg0Mjk0ZiRjNmMyY2E2ZDA0MjI0OWFmMGNjN2Q3YTllOTYyNTc0Mw=="
cloud.auth: "metricbeat_setup:{pwd}" 1
- This examples shows a hard-coded password, but you should store sensitive values in the secrets keystore.
Set the host and port where Metricbeat can find the Elasticsearch installation, and set the username and password of a user who is authorized to set up Metricbeat. For example:
output.elasticsearch: hosts: ["https://myEShost:9200"] username: "metricbeat_internal" password: "{pwd}" 1 ssl: enabled: true ca_trusted_fingerprint: "b9a10bbe64ee9826abeda6546fc988c8bf798b41957c33d05db736716513dc9c" 2- This example shows a hard-coded password, but you should store sensitive values in the secrets keystore.
- This example shows a hard-coded fingerprint, but you should store sensitive values in the secrets keystore. The fingerprint is a HEX encoded SHA-256 of a CA certificate, when you start Elasticsearch for the first time, security features such as network encryption (TLS) for Elasticsearch are enabled by default. If you are using the self-signed certificate generated by Elasticsearch when it is started for the first time, you will need to add its fingerprint here. The fingerprint is printed on Elasticsearch start up logs, or you can refer to connect clients to Elasticsearch documentation for other options on retrieving it. If you are providing your own SSL certificate to Elasticsearch refer to Metricbeat documentation on how to setup SSL.
If you plan to use our pre-built Kibana dashboards, configure the Kibana endpoint. Skip this step if Kibana is running on the same host as Elasticsearch.
setup.kibana: host: "mykibanahost:5601" 1 username: "my_kibana_user" <2> 23 password: "{pwd}"- The hostname and port of the machine where Kibana is running, for example,
mykibanahost:5601. If you specify a path after the port number, include the scheme and port:http://mykibanahost:5601/path. - The
usernameandpasswordsettings for Kibana are optional. If you don’t specify credentials for Kibana, Metricbeat uses theusernameandpasswordspecified for the Elasticsearch output. - To use the pre-built Kibana dashboards, this user must be authorized to view dashboards or have the
kibana_adminbuilt-in role.
- The hostname and port of the machine where Kibana is running, for example,
To learn more about required roles and privileges, see Grant users access to secured resources.
You can send data to other outputs, such as Logstash, but that requires additional configuration and setup.
Metricbeat uses modules to collect metrics. Each module defines the basic logic for collecting data from a specific service, such as Redis or MySQL. A module consists of metricsets that fetch and structure the data. Read How Metricbeat works to learn more.
Identify the modules you need to enable. To see the list of available modules, run:
metricbeat modules list
```
metricbeat modules list
```
./metricbeat modules list
```
./metricbeat modules list
```
PS > .\metricbeat.exe modules list
```
metricbeat modules enable nginx
```
metricbeat modules enable nginx
```
./metricbeat modules enable nginx
```
./metricbeat modules enable nginx
```
PS > .\metricbeat.exe modules enable nginx
```
metricbeat setup -e
```
metricbeat setup -e
```
./metricbeat setup -e
```
./metricbeat setup -e
```
PS > .\metricbeat.exe setup -e
```
sudo service metricbeat start
If you use an init.d script to start Metricbeat, you can’t specify command line flags (see Command reference). To specify flags, start Metricbeat in the foreground.
Also see Metricbeat and systemd.
sudo service metricbeat start
If you use an init.d script to start Metricbeat, you can’t specify command line flags (see Command reference). To specify flags, start Metricbeat in the foreground.
Also see Metricbeat and systemd.
sudo chown root metricbeat.yml 1
sudo chown root modules.d/nginx.yml 1
sudo ./metricbeat -e
- You’ll be running Metricbeat as root, so you need to change ownership of the configuration file and any configurations enabled in the
modules.ddirectory, or run Metricbeat with--strict.perms=falsespecified. See Config File Ownership and Permissions.
PS C:\Program Files\metricbeat> Start-Service metricbeat
By default, Windows log files are stored in C:\ProgramData\metricbeat\Logs.
On Windows, statistics about system load and swap usage are currently not captured
Metricbeat should begin streaming metrics to Elasticsearch.
Metricbeat comes with pre-built Kibana dashboards and UIs for visualizing log data. You loaded the dashboards earlier when you ran the setup command.
To open the dashboards:
Launch Kibana:
<div class="tabs" data-tab-group="host">
<div role="tablist" aria-label="Open Kibana">
<button role="tab"
aria-selected="true"
aria-controls="cloud-tab-open-kibana"
id="cloud-open-kibana">
Elasticsearch Service
</button>
<button role="tab"
aria-selected="false"
aria-controls="self-managed-tab-open-kibana"
id="self-managed-open-kibana"
tabindex="-1">
Self-managed
</button>
</div>
<div tabindex="0"
role="tabpanel"
id="cloud-tab-open-kibana"
aria-labelledby="cloud-open-kibana">- Log in to your Elastic Cloud account.
- Navigate to the Kibana endpoint in your deployment.
</div>
<div tabindex="0"
role="tabpanel"
id="self-managed-tab-open-kibana"
aria-labelledby="self-managed-open-kibana"
hidden="">
Point your browser to http://localhost:5601, replacinglocalhostwith the name of the Kibana host.</div>
</div>In the side navigation, click Discover. To see Metricbeat data, make sure the predefined
metricbeat-*data view is selected.TipIf you don’t see data in Kibana, try changing the time filter to a larger range. By default, Kibana shows the last 15 minutes.
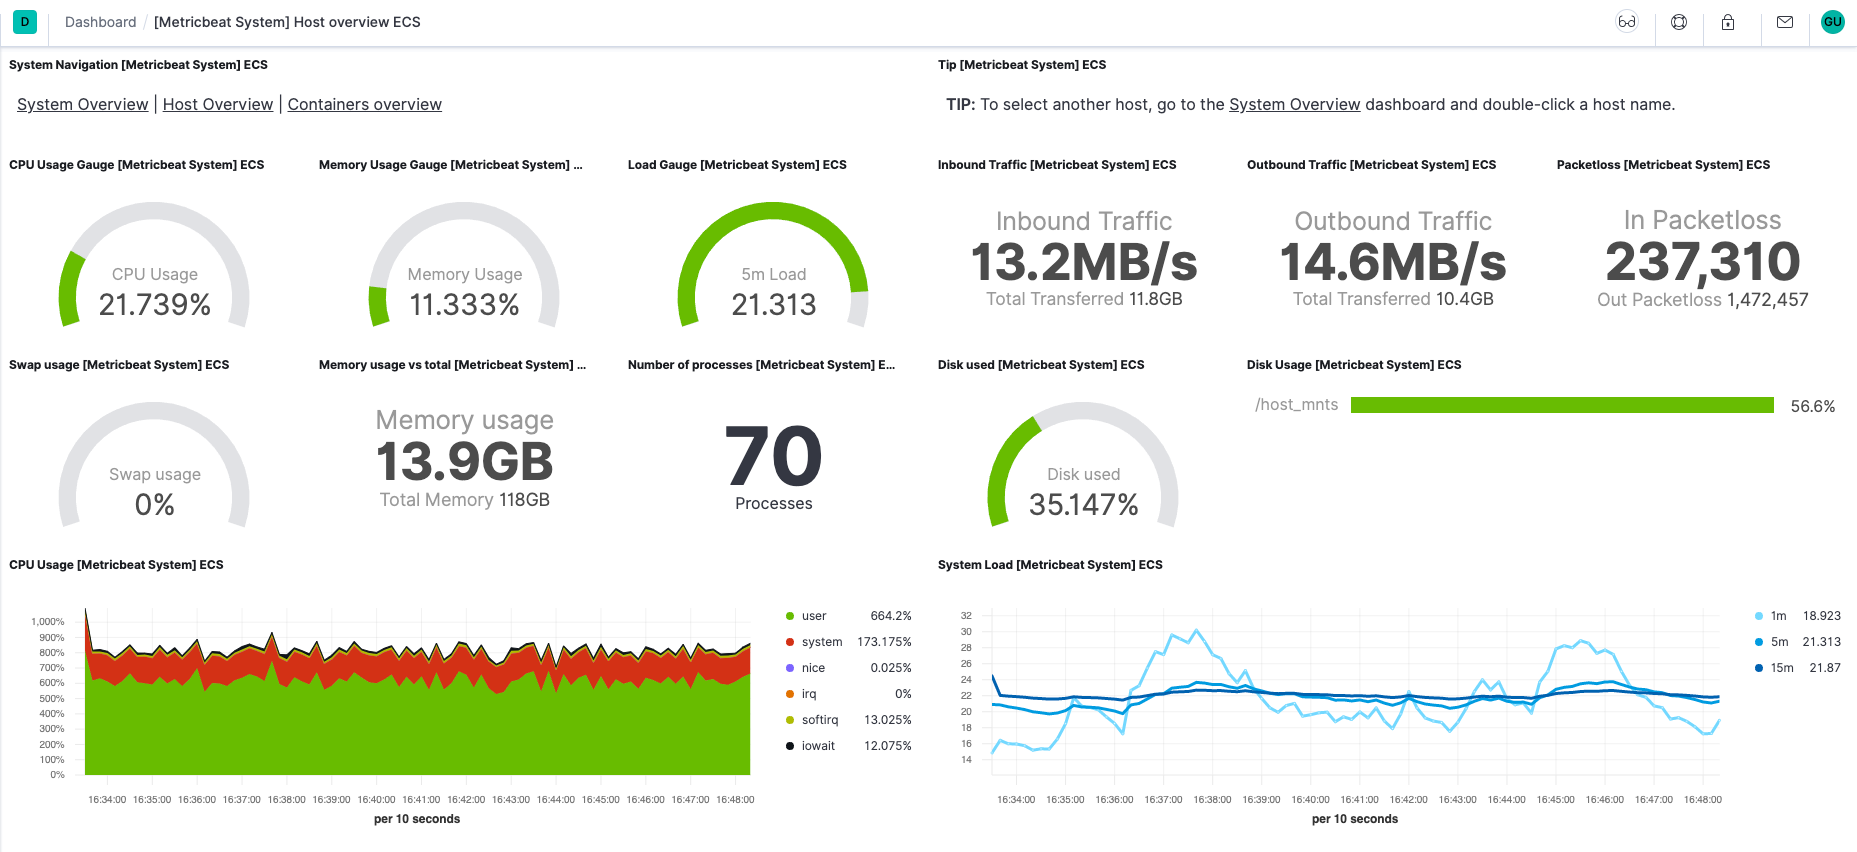
In the side navigation, click Dashboard, then select the dashboard that you want to open.
The dashboards are provided as examples. We recommend that you customize them to meet your needs.
Now that you have your infrastructure metrics streaming into Elasticsearch, learn how to unify your logs, metrics, uptime, and application performance data.
Ingest data from other sources by installing and configuring other Elastic Beats:
Elastic Beats To capture Filebeat Logs Winlogbeat Windows event logs Heartbeat Uptime information APM Application performance metrics Auditbeat Audit events Use the Observability apps in Kibana to search across all your data:
Elastic apps Use to Metrics app Explore metrics about systems and services across your ecosystem Logs app Tail related log data in real time Uptime app Monitor availability issues across your apps and services APM app Monitor application performance SIEM app Analyze security events