Tomcat module
This functionality is in beta and is subject to change. The design and code is less mature than official GA features and is being provided as-is with no warranties. Beta features are not subject to the support SLA of official GA features.
Refer to the Elastic Integrations documentation.
Learn more
Elastic Agent is a single, unified way to add monitoring for logs, metrics, and other types of data to a host. It can also protect hosts from security threats, query data from operating systems, forward data from remote services or hardware, and more. Refer to the documentation for a detailed comparison of Beats and Elastic Agent.
This module periodically fetches JMX metrics from Apache Tomcat.
The module has been tested with Tomcat 7.0.24 and 9.0.24. Other versions are expected to work.
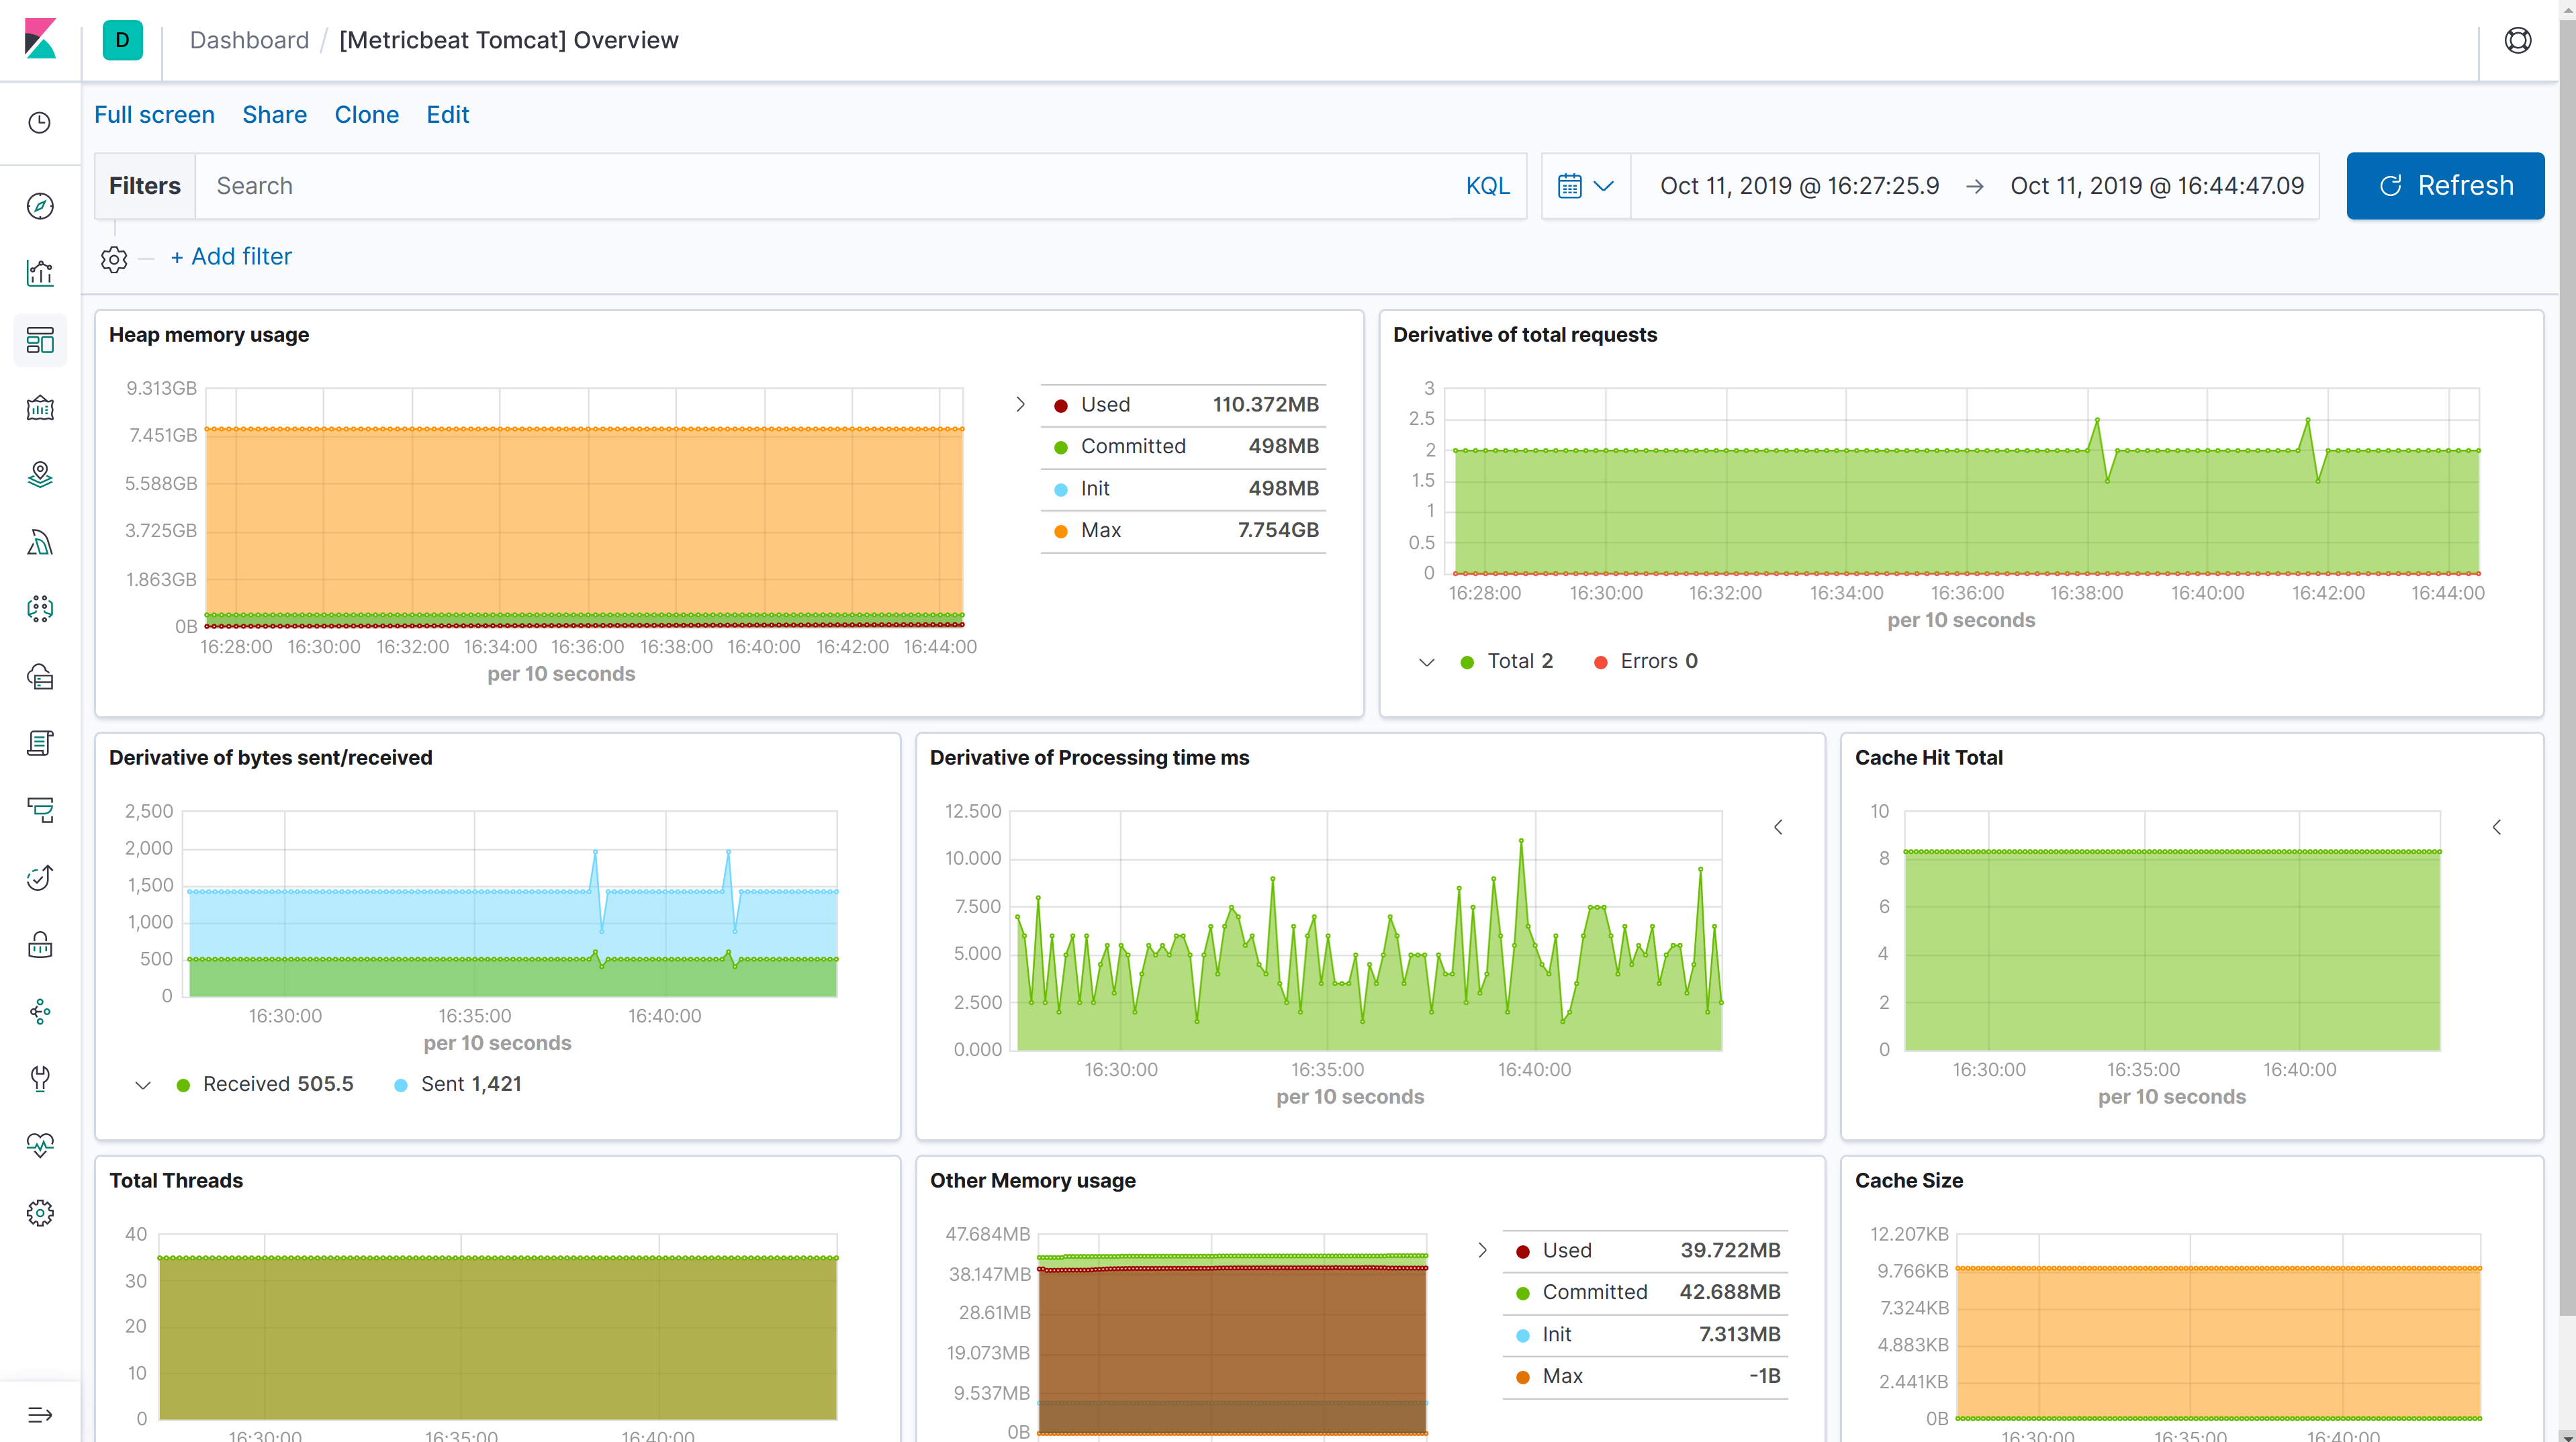
An overview dashboard for Kibana is already included:
The Tomcat module requires Jolokiato fetch JMX metrics. Refer to the link for instructions about how to use Jolokia.
The Tomcat module supports the standard configuration options that are described in Modules. Here is an example configuration:
metricbeat.modules:
- module: tomcat
metricsets: ['threading', 'cache', 'memory', 'requests']
period: 10s
hosts: ['localhost:8080']
path: "/jolokia/?ignoreErrors=true&canonicalNaming=false"
The following metricsets are available: