AWS dynamodb metricset
This functionality is in beta and is subject to change. The design and code is less mature than official GA features and is being provided as-is with no warranties. Beta features are not subject to the support SLA of official GA features.
The dynamodb metricset of aws module allows you to monitor your AWS DynamoDB database. dynamodb metricset fetches a set of values from Amazon DynamoDB Metrics. For all other DynamoDB metrics, the aggregation granularity is five minutes.
- module: aws
period: 300s
metricsets:
- dynamodb
# This module uses the aws cloudwatch metricset, all
# the options for this metricset are also available here.
The aws dynamodb metricset comes with a predefined dashboard. For example:
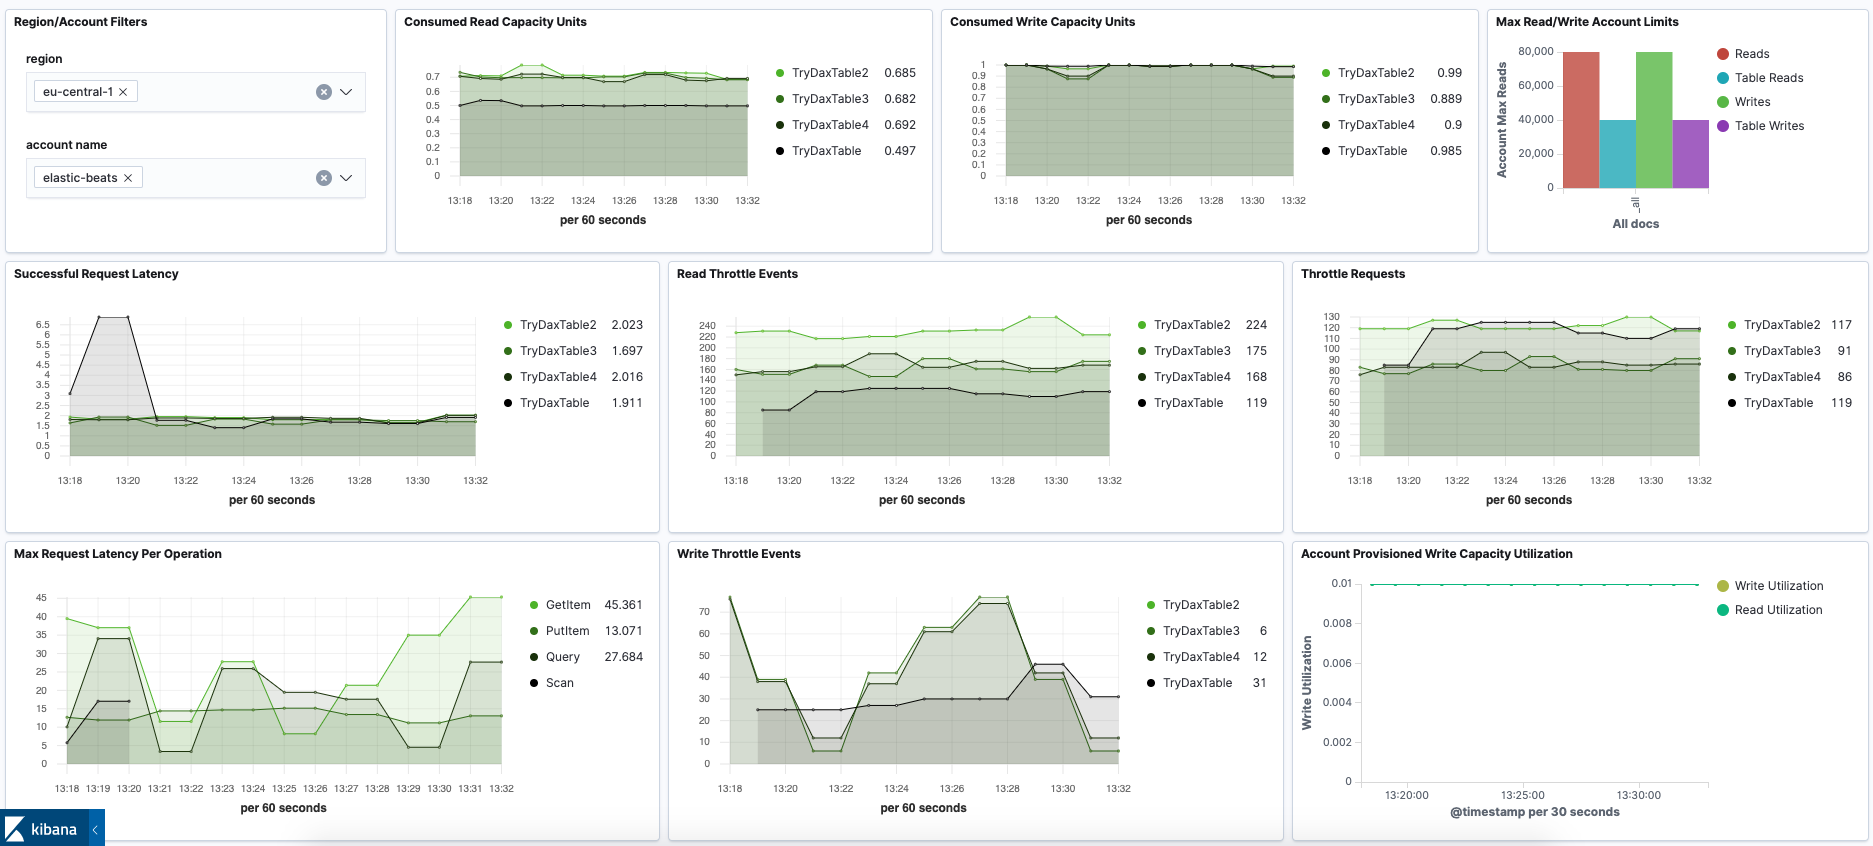
Please see more details for each metric in Amazon DynamoDB Metrics.
| Metric Name | Statistic Method |
| SuccessfulRequestLatency | Average |
| OnlineIndexPercentageProgress | Average |
| ProvisionedWriteCapacityUnits | Average |
| ProvisionedReadCapacityUnits | Average |
| ConsumedReadCapacityUnits | Average |
| ConsumedWriteCapacityUnits | Average |
| ReplicationLatency | Average |
| TransactionConflict | Average |
| AccountProvisionedReadCapacityUtilization | Average |
| AccountProvisionedWriteCapacityUtilization | Average |
| SystemErrors | Sum |
| ConsumedReadCapacityUnits | Sum |
| ConsumedWriteCapacityUnits | Sum |
| ConditionalCheckFailedRequests | Sum |
| PendingReplicationCount | Sum |
| TransactionConflict | Sum |
| ReadThrottleEvents | Sum |
| ThrottledRequests | Sum |
| WriteThrottleEvents | Sum |
| SuccessfulRequestLatency | Maximum |
| ReplicationLatency | Maximum |
| AccountMaxReads | Maximum |
| AccountMaxTableLevelReads | Maximum |
| AccountMaxTableLevelWrites | Maximum |
| AccountMaxWrites | Maximum |
| MaxProvisionedTableReadCapacityUtilization | Maximum |
| MaxProvisionedTableWriteCapacityUtilization | Maximum |
This is a default metricset. If the host module is unconfigured, this metricset is enabled by default.
For a description of each field in the metricset, see the exported fields section.
Here is an example document generated by this metricset:
{
"@timestamp": "2020-01-10T11:01:22.612Z",
"@metadata": {
"beat": "metricbeat",
"type": "_doc",
"version": "8.0.0"
},
"host": {
"id": "883134FF-0EC4-5E1B-9F9E-FD06FB681D84",
"hostname": "vm1",
"architecture": "x86_64",
"name": "vm1",
"os": {
"family": "darwin",
"name": "Mac OS X",
"kernel": "18.7.0",
"build": "18G95",
"platform": "darwin",
"version": "10.14.6"
}
},
"agent": {
"hostname": "vm1",
"id": "fbaf40e4-c9f2-4d9f-840f-b3d8de51b42c",
"version": "8.0.0",
"type": "metricbeat",
"ephemeral_id": "ccb69319-4fbd-4881-996a-4c710322da8b"
},
"cloud": {
"region": "eu-central-1",
"account": {
"name": "elastic-beats",
"id": "428152502467"
},
"provider": "aws"
},
"aws": {
"dimensions": {
"TableName": "TryDaxTable",
"Operation": "Query"
},
"dynamodb": {
"metrics": {
"SuccessfulRequestLatency": {
"avg": 1.6592021822660081,
"max": 2.883089
},
"ThrottledRequests": {
"sum": 112
}
}
},
"cloudwatch": {
"namespace": "AWS/DynamoDB"
}
},
"event": {
"duration": 1447079629,
"dataset": "aws.dynamodb",
"module": "aws"
},
"metricset": {
"name": "dynamodb",
"period": 60000
},
"service": {
"type": "aws"
},
"ecs": {
"version": "1.2.0"
}
}