CockroachDB module
Refer to the Elastic Integrations documentation.
Learn more
Elastic Agent is a single, unified way to add monitoring for logs, metrics, and other types of data to a host. It can also protect hosts from security threats, query data from operating systems, forward data from remote services or hardware, and more. Refer to the documentation for a detailed comparison of Beats and Elastic Agent.
This module periodically fetches metrics from CockroachDB.
The CockroachDB status metricset is compatible with any CockroachDB version exposing metrics in Prometheus format.
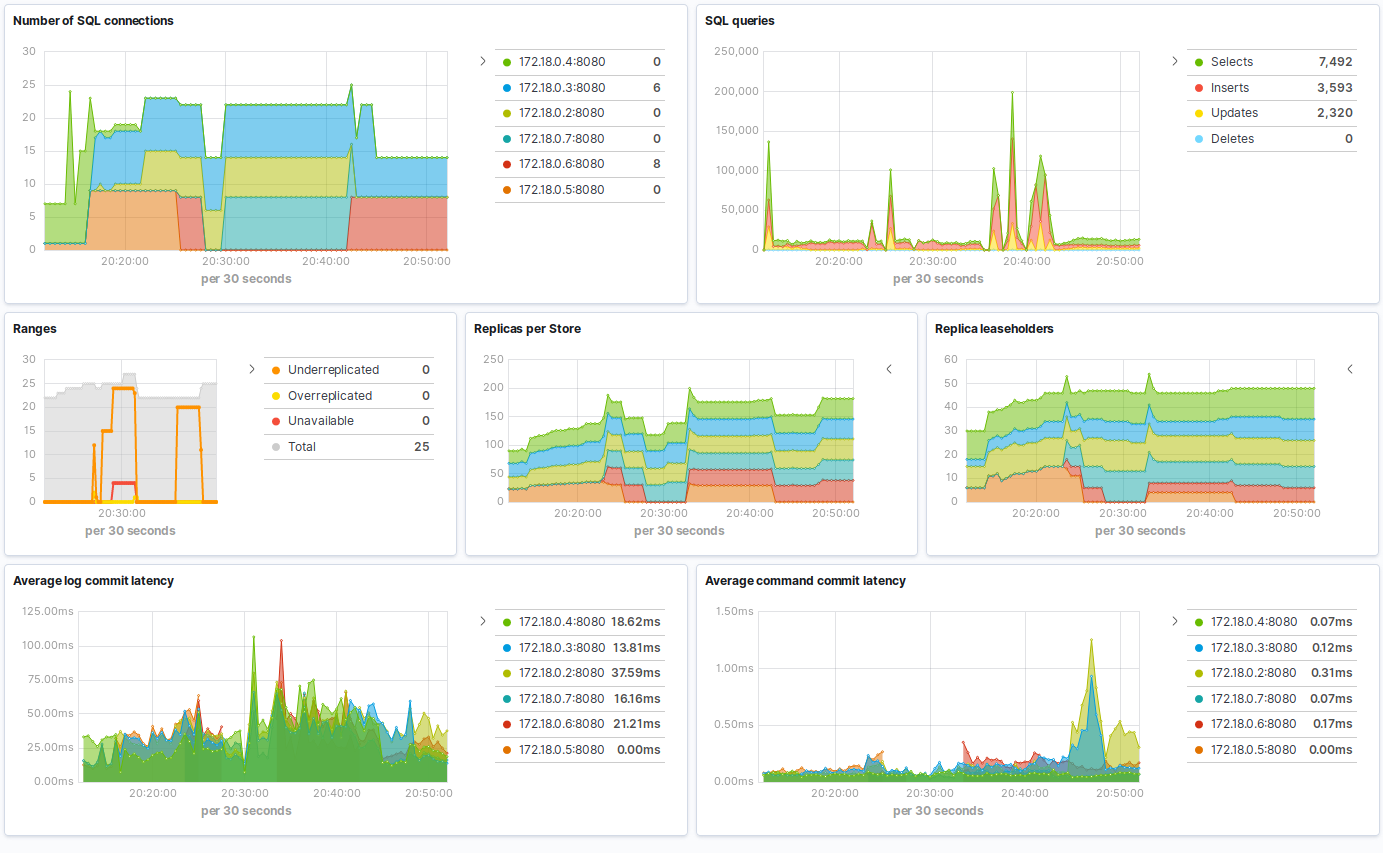
The CockroachDB module includes a predefined dashboard with overview information of the monitored servers.
The CockroachDB module supports the standard configuration options that are described in Modules. Here is an example configuration:
metricbeat.modules:
- module: cockroachdb
metricsets: ['status']
period: 10s
hosts: ['localhost:8080']
# This module uses the Prometheus collector metricset, all
# the options for this metricset are also available here.
#metrics_path: /_status/vars
This module supports TLS connections when using ssl config field, as described in SSL. It also supports the options described in Standard HTTP config options.
The following metricsets are available: