Collect Logstash monitoring data for dashboards
Elastic Agent collects monitoring data from your Logstash instance, sends it directly to your monitoring cluster, and shows the data in Logstash dashboards.
You can enroll Elastic Agent in Fleet for management from a central location, or you can run Elastic Agent standalone.
Prerequisites
Complete these steps as you prepare to collect and ship monitoring data for dashboards:
Disable default collection of Logstash monitoring metrics
Set monitoring.enabled to false in logstash.yml to disable default collection:
monitoring.enabled: false
Specify the target cluster_uuid (optional)
To bind the metrics of Logstash to a specific cluster, optionally define the monitoring.cluster_uuid in the configuration file (logstash.yml):
monitoring.cluster_uuid: PRODUCTION_ES_CLUSTER_UUID
Create a monitoring user (standalone agent only)
Create a user on the production cluster that has the remote_monitoring_collector built-in role.
Install and configure Elastic Agent to collect Logstash monitoring data for dashboards. We’ll walk you through the process in these steps:
- Add the Elastic Agent Logstash integration to monitor host logs and metrics
- Install and run an Elastic Agent on your machine
- View assets
- Monitor Logstash logs and metrics
Check out Installing Elastic Agent in the Fleet and Elastic Agent Guide for more info.
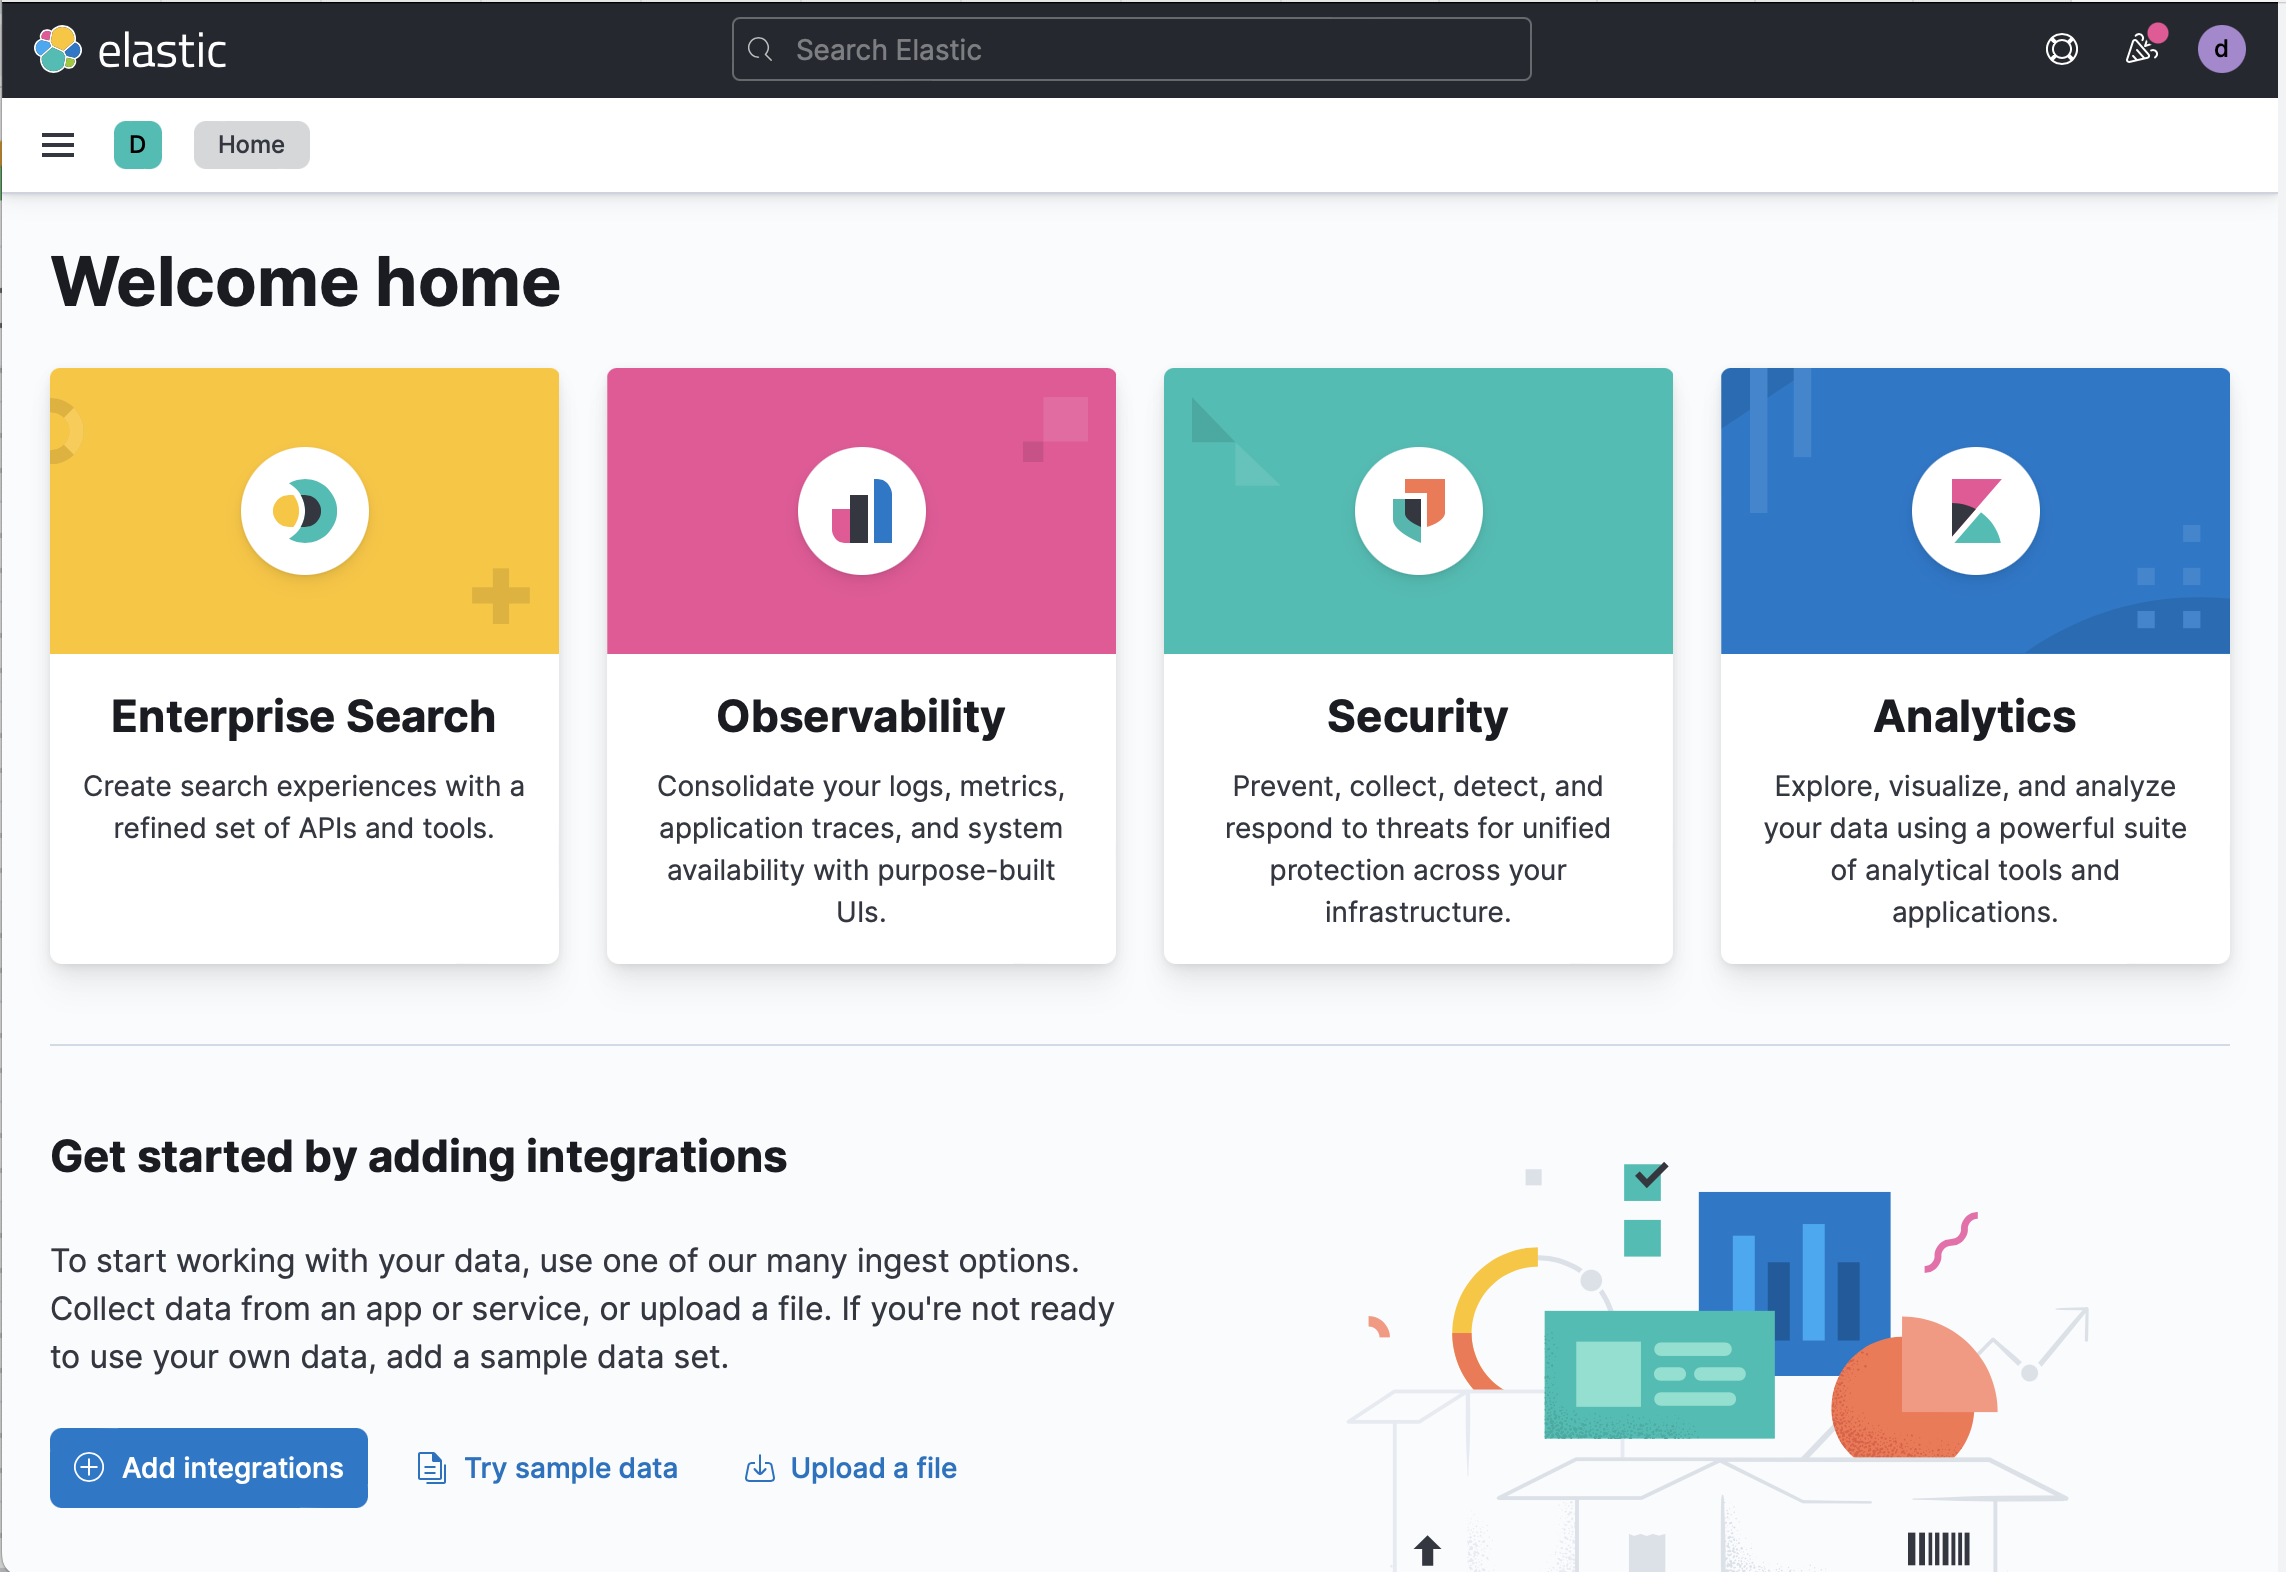
Go to the Kibana home page, and click Add integrations.
In the query bar, search for Logstash and select the integration to see more details.
Click Add Logstash.
Configure the integration name and add a description (optional).
Configure the integration to collect logs.
- Make sure that Logs is turned on if you want to collect logs from your Logstash instance. Be sure that the required settings are correctly configured.
- Under Logs, modify the log paths to match your Logstash environment.
Configure the integration to collect metrics.
- Make sure that Metrics (Technical Preview) is turned on, and Metrics (Stack Monitoring) is turned off.
- Under Metrics (Technical Preview), make sure the Logstash URL setting points to your Logstash instance URLs.
By default, the integration collects Logstash monitoring metrics fromhttps://localhost:9600. If that host and port number are not correct, update theLogstash URLsetting. If you configured Logstash to use encrypted communications and/or a username and password, you must access it via HTTPS, and expand the Advanced Settings options, and fill in with the appropriate values for your Logstash instance.
Click Save and continue.
This step takes a minute or two to complete. When it’s done, you’ll have an agent policy that contains a system integration policy for the configuration you just specified.In the popup, click Add Elastic Agent to your hosts to open the Add agent flyout.
TipIf you accidentally close the popup, go to Fleet > Agents and click Add agent.
The Add agent flyout has two options: Enroll in Fleet and Run standalone. Enrolling agents in Fleet (default) provides a centralized management tool in Kibana, reducing management overhead.
When the Add Agent flyout appears, stay on the Enroll in fleet tab.
Skip the Select enrollment token step. The enrollment token you need is already selected.
NoteThe enrollment token is specific to the Elastic Agent policy that you just created. When you run the command to enroll the agent in Fleet, you will pass in the enrollment token.
Download, install, and enroll the Elastic Agent on your host by selecting your host operating system and following the Install Elastic Agent on your host step.
It takes about a minute for Elastic Agent to enroll in Fleet, download the configuration specified in the policy you just created, and start collecting data.
- When the Add Agent flyout appears, navigate to the Run standalone tab.
- Configure the agent. Follow the instructions in Install Elastic Agent on your host.
- After unpacking the binary, replace the
elastic-agent.ymlfile with that supplied in the Add Agent flyout on the "Run standalone" tab, replacing the values ofES_USERNAMEandES_PASSWORDappropriately. - Run
sudo ./elastic-agent install
After you have confirmed enrollment and data is coming in, click View assets to access dashboards related to the Logstash integration.
For traditional Stack Monitoring UI, the dashboards marked [Logs Logstash] are used to visualize the logs produced by your Logstash instances, with those marked [Metrics Logstash] for the technical preview metrics dashboards. These are populated with data only if you selected the Metrics (Technical Preview) checkbox.
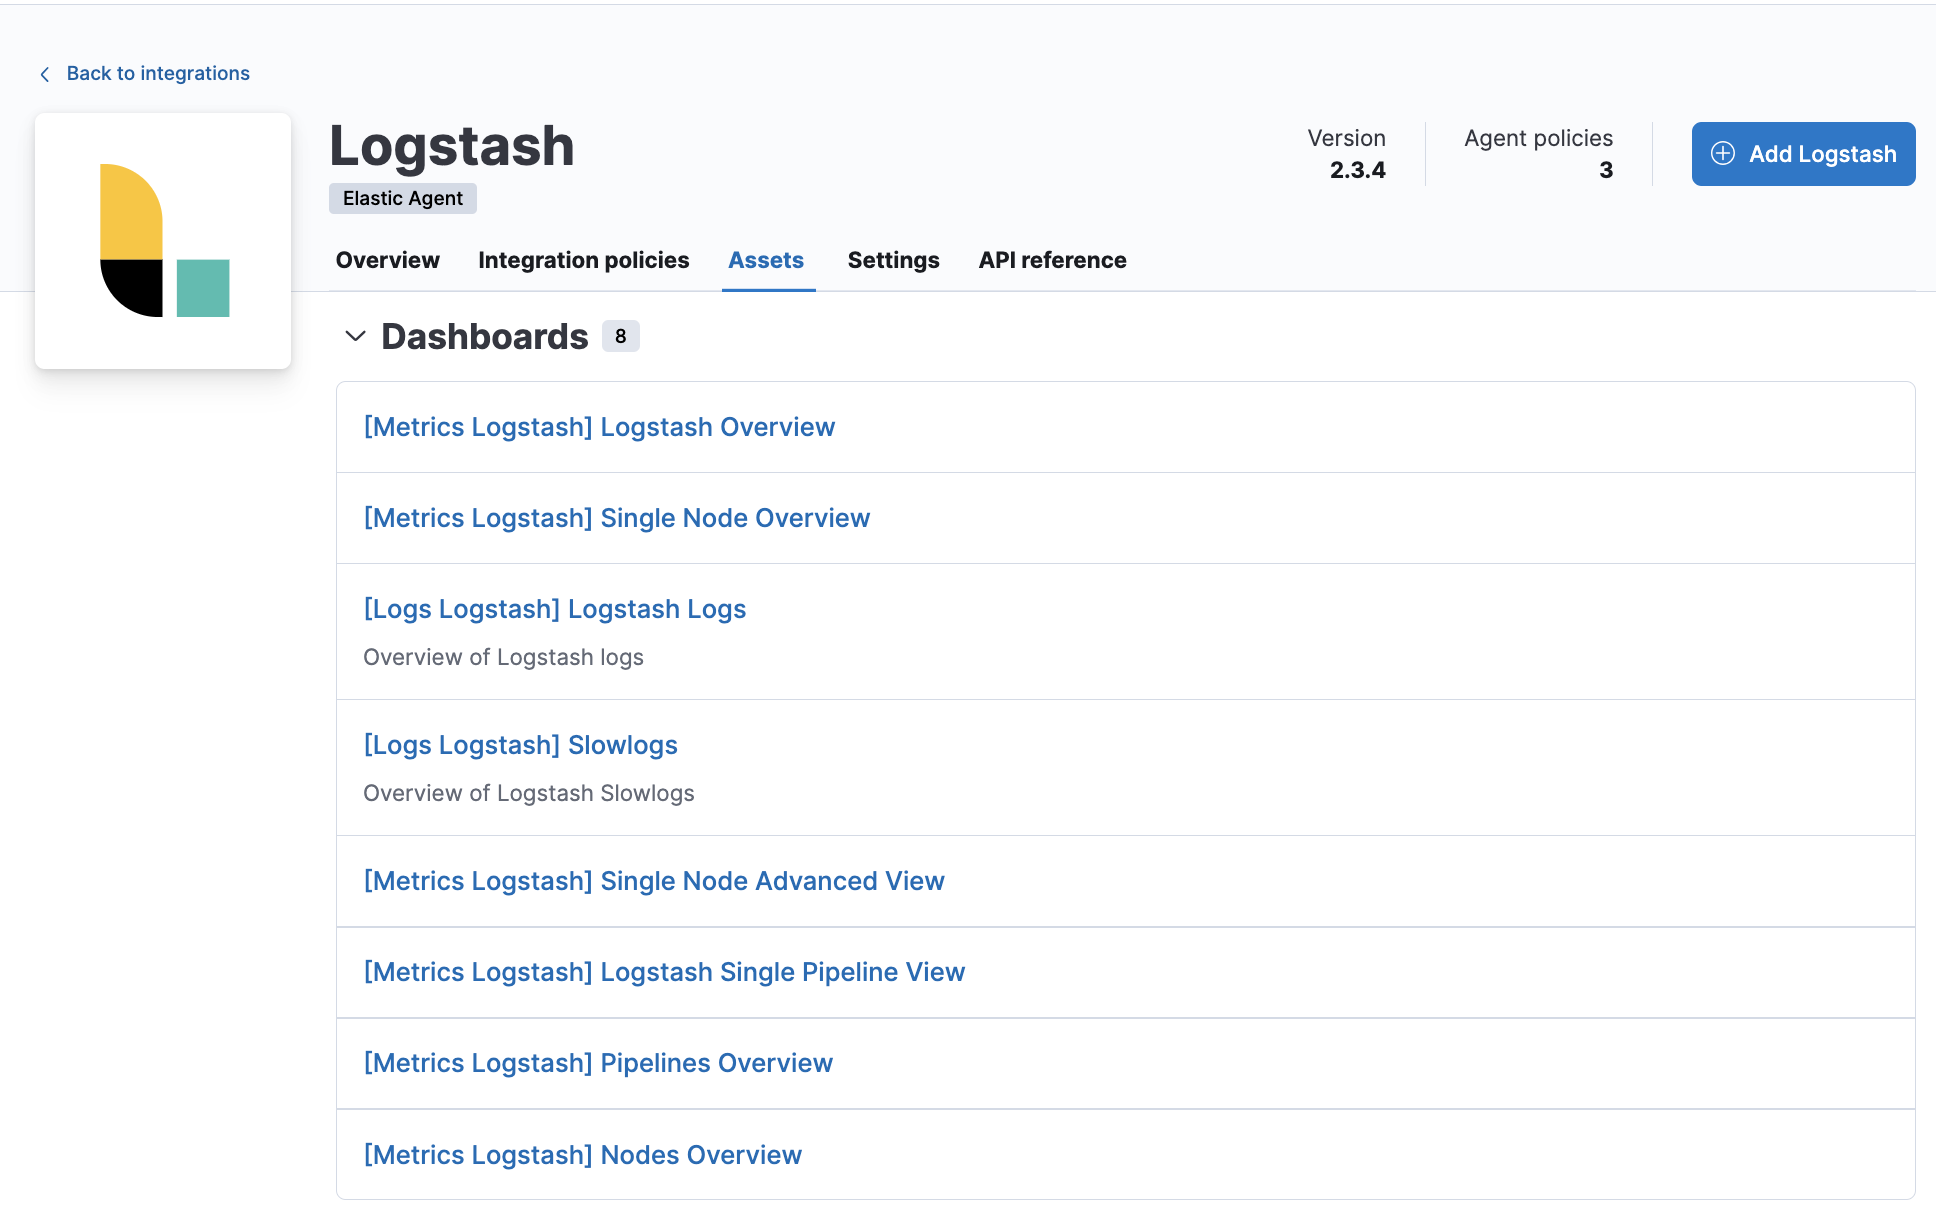
A number of dashboards are included to view Logstash as a whole, and dashboards that allow you to drill-down into how Logstash is performing on a node, pipeline and plugin basis.
From the list of assets, open the [Metrics Logstash] Logstash overview dashboard to view overall performance. Then follow the navigation panel to further drill down into Logstash performance.
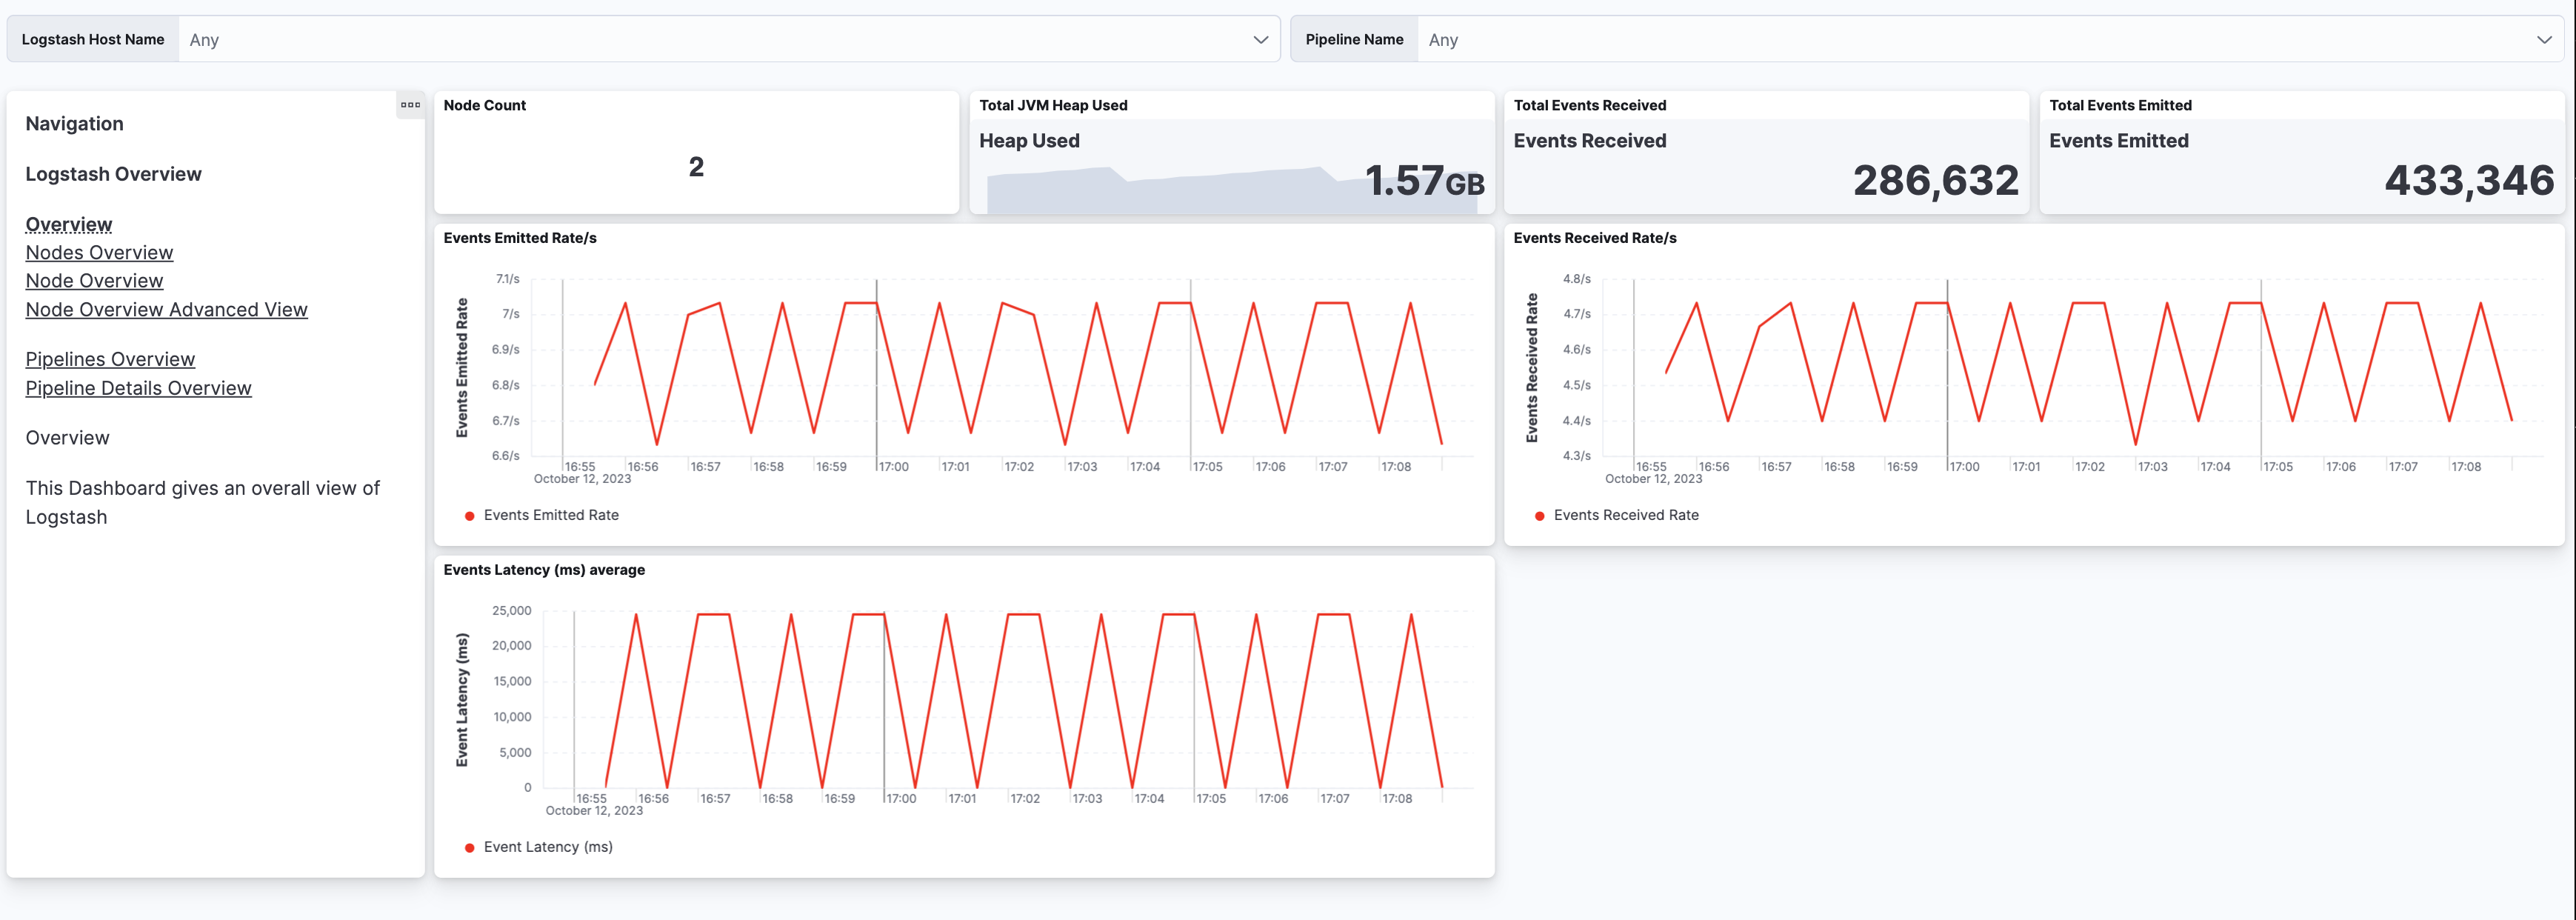
You can hover over any visualization to adjust its settings, or click the Edit button to make changes to the dashboard. To learn more, refer to Dashboard and visualizations.