ActiveMQ queue metricset
This is the queue metricset of the ActiveMQ module.
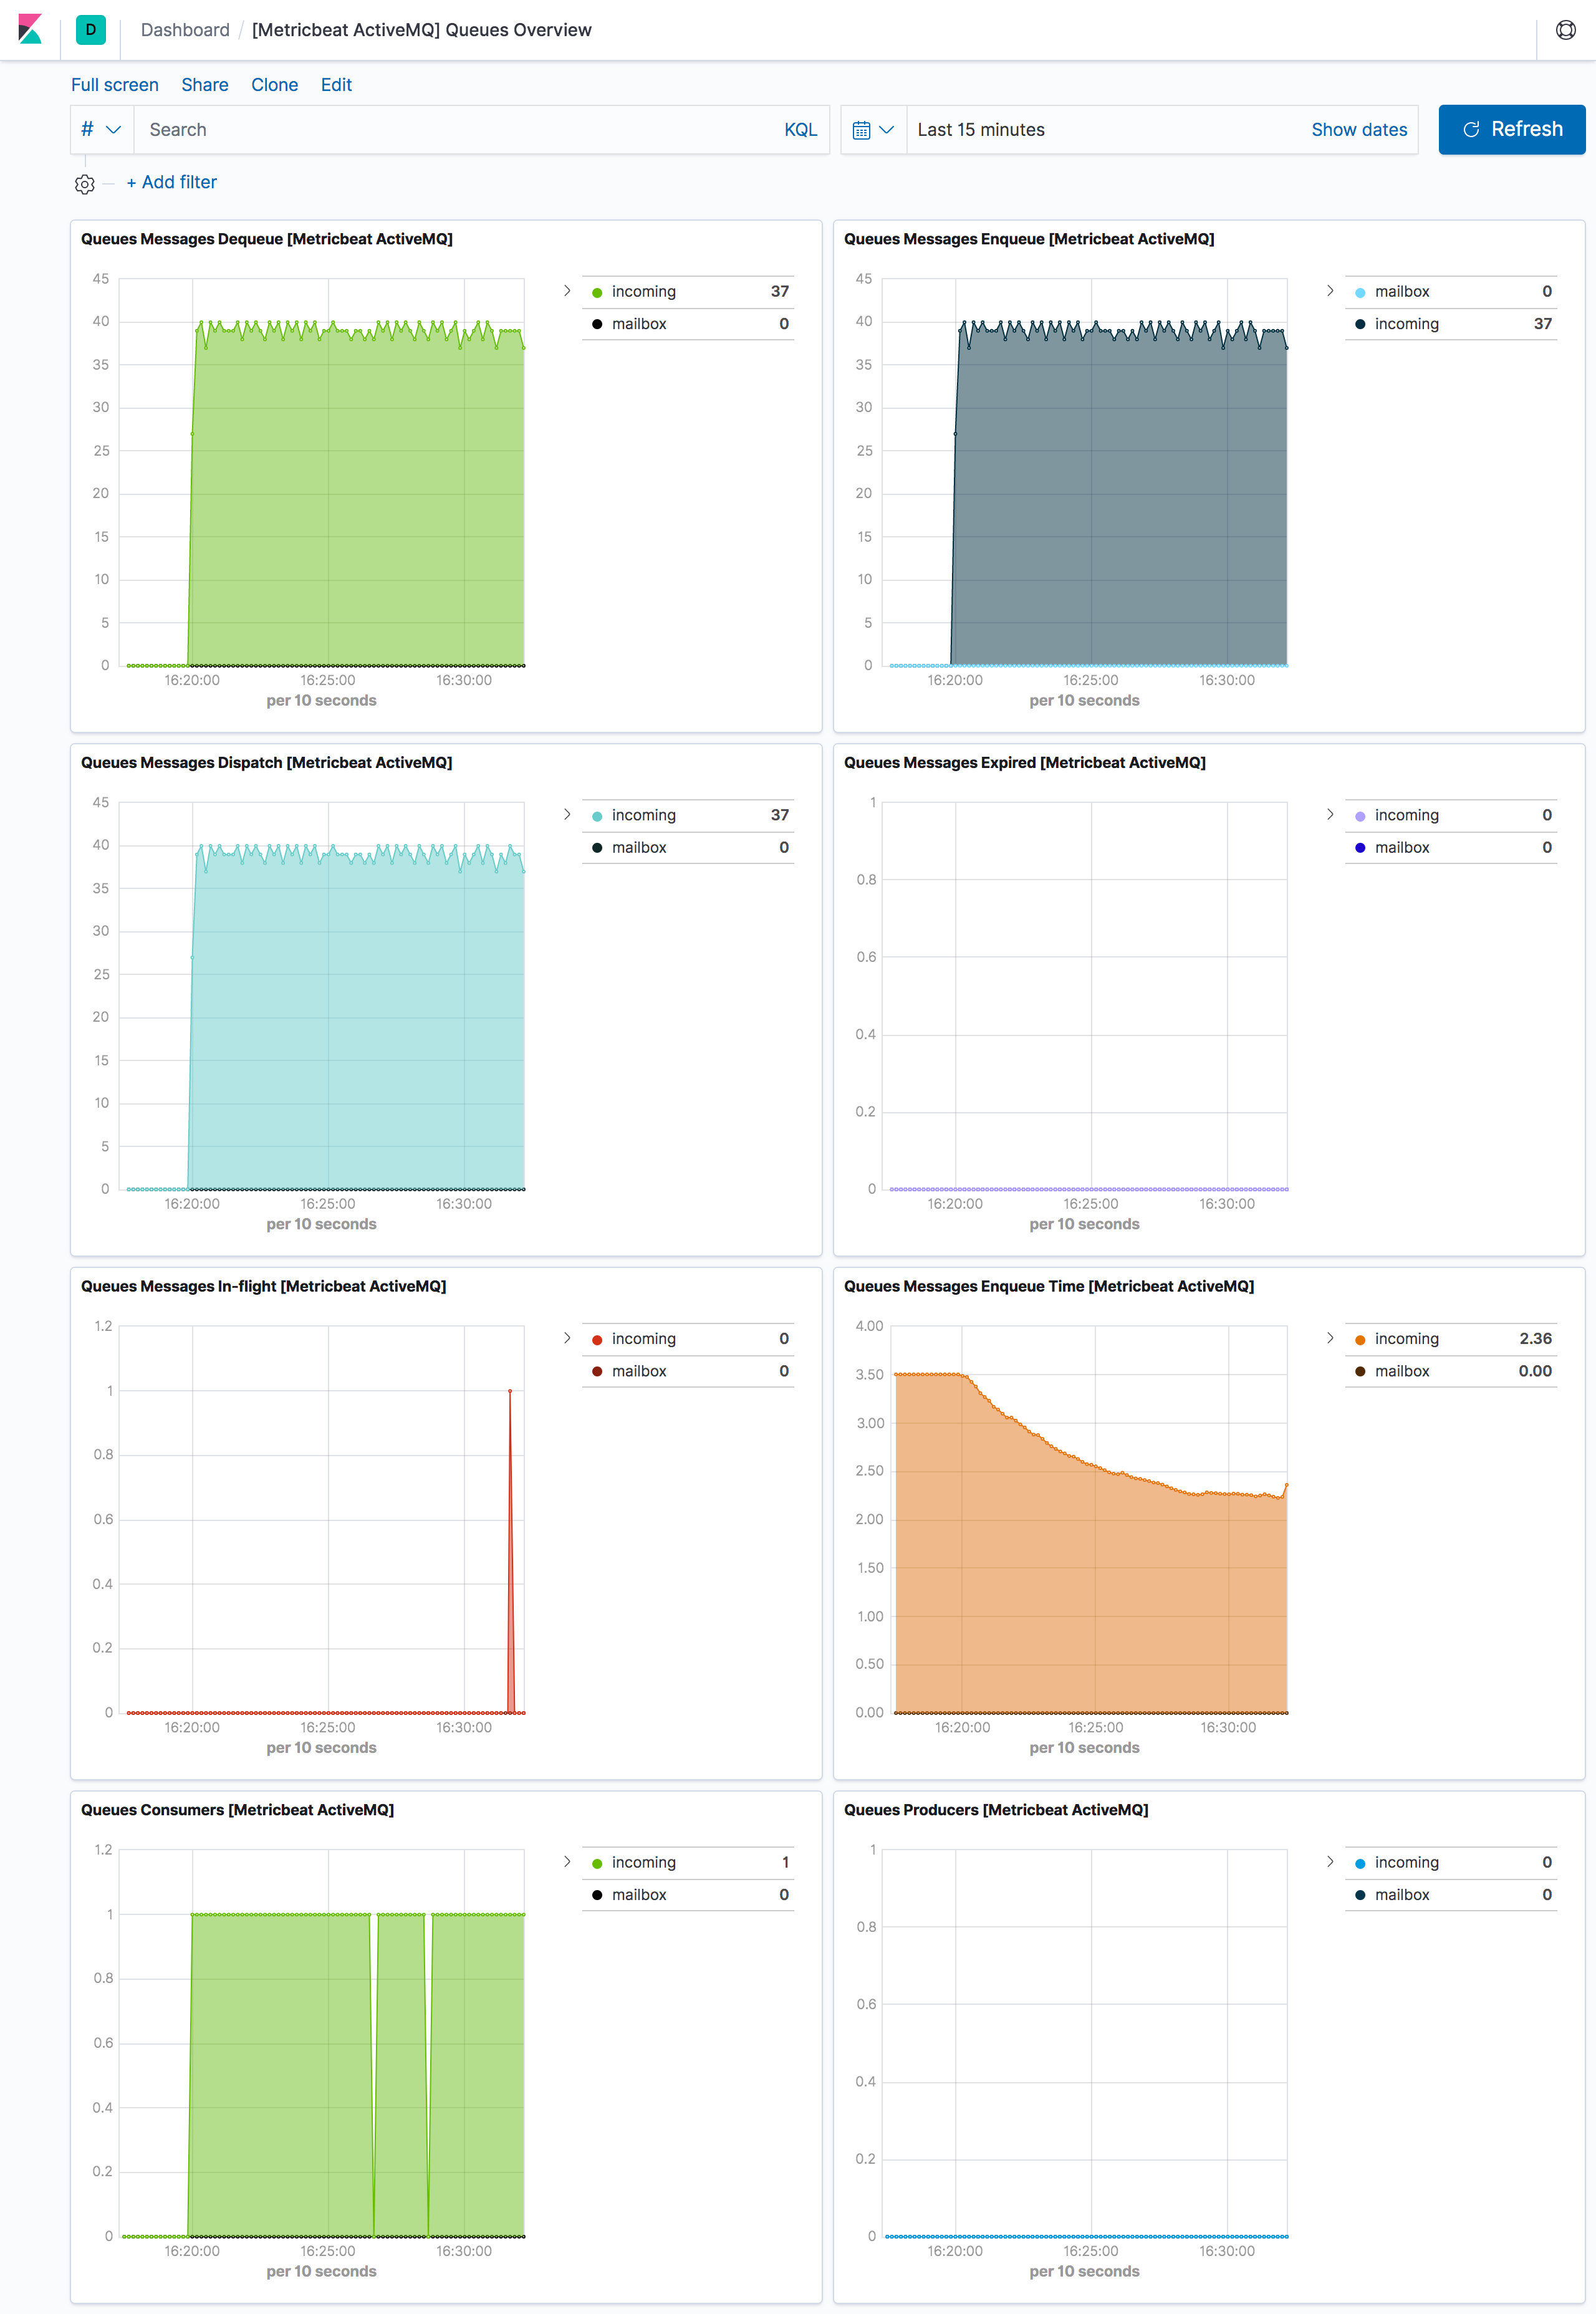
The metricset provides metrics describing the available ActiveMQ queues, especially exchanged messages (enqueued, dequeued, expired, in-flight), connected consumers, producers and its current length.
To collect data, the module communicates with a Jolokia HTTP/REST endpoint that exposes the JMX metrics over HTTP/REST/JSON (JMX key: org.apache.activemq:brokerName=localhost,destinationName=sample_queue,destinationType=Queue,type=Broker).
The queue metricset comes with a predefined dashboard:
This is a default metricset. If the host module is unconfigured, this metricset is enabled by default.
For a description of each field in the metricset, see the exported fields section.
Here is an example document generated by this metricset:
{
"@timestamp": "2019-11-19T13:13:56.283Z",
"@metadata": {
"beat": "metricbeat",
"type": "_doc",
"version": "8.0.0"
},
"metricset": {
"name": "queue",
"period": 5000
},
"ecs": {
"version": "1.2.0"
},
"host": {
"name": "macbook.local"
},
"agent": {
"ephemeral_id": "e830f069-d442-498c-af73-6b02fa8b0f90",
"hostname": "macbook.local",
"id": "8d20f9a9-b24d-419b-97e6-bcccfb64679c",
"version": "8.0.0",
"type": "metricbeat"
},
"service": {
"type": "activemq",
"address": "localhost:33049"
},
"activemq": {
"queue": {
"producers": {
"count": 0
},
"name": "sample_queue",
"memory": {
"broker": {
"pct": 0
}
},
"size": 2,
"consumers": {
"count": 0
},
"mbean": "org.apache.activemq:brokerName=localhost,destinationName=sample_queue,destinationType=Queue,type=Broker",
"messages": {
"size": {
"avg": 1037
},
"expired": {
"count": 0
},
"dequeue": {
"count": 0
},
"inflight": {
"count": 0
},
"dispatch": {
"count": 0
},
"enqueue": {
"time": {
"avg": 0,
"min": 0,
"max": 0
},
"count": 2
}
}
}
},
"event": {
"dataset": "activemq.queue",
"module": "activemq",
"duration": 16081129
}
}