Threat Map
<div class="condensed-table">
| | |
| --- | --- |
| Version | 0.1.2 [beta] (View all) |
| Compatible Kibana version(s) | 8.14.0 or higher |
| Supported Serverless project types
What’s this? | Security
Observability |
| Subscription level
What’s this? | Basic |
| Level of support
What’s this? | Elastic |
</div>
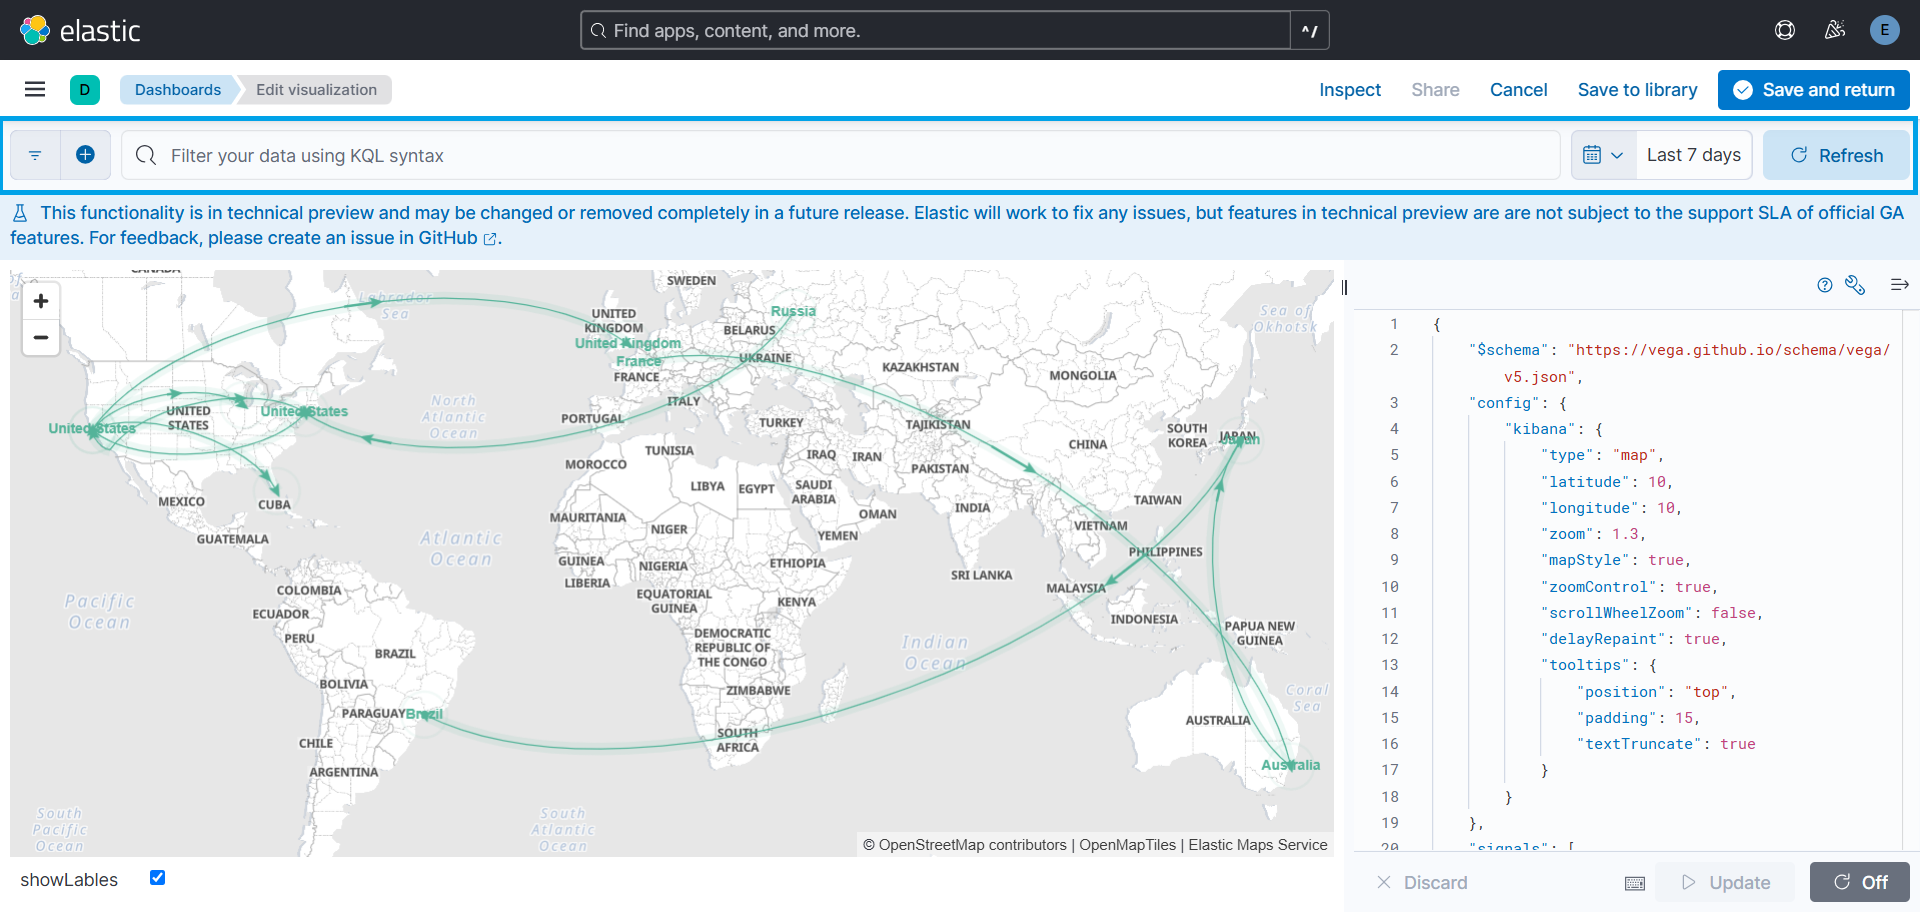
The Threat Map dashboard visualizes network traffic flow between regions using directed paths and animations. It includes arrows indicating direction and pulsing arcs at the destination.
[TBC: QUOTE]
<hr>
To use the Threat Map dashboard, ensure the following:
Timestamp Field: Documents must contain a
@timestampfield for time-range filtering.GeoIP Processor: Apply a GeoIP processor to the IP field. The resulting document should contain
source.geoanddestination.geofields.Here is an example of an ingest pipeline that adds the geographical information to the
geofield based on theipfield.PUT _ingest/pipeline/geoip { "description" : "Add ip geolocation info", "processors" : [ { "geoip" : { "field" : "source.ip", "target_field" : "source.geo" } }, { "geoip" : { "field" : "destination.ip", "target_field" : "destination.geo" } } ] }
Data View: Use documents accessible via the
logs-*data view.
<hr>
Data is retrieved from Elasticsearch using the _all,*:_all index search endpoint. Ensure the following fields exist in each document:
| Field | Description | Required/Optional | Default Value |
|---|---|---|---|
source.geo.location.lat |
Latitude of the source | Required | |
source.geo.location.lon |
Longitude of the source | Required | |
source.geo.country_name |
Country name of the source | Required | |
source.ip |
IP address of the source | Required | |
destination.geo.location.lat |
Latitude of the destination | Required | |
destination.geo.location.lon |
Longitude of the destination | Required | |
destination.geo.country_name |
Country name of the destination | Required | |
destination.ip |
IP address of the destination | Required | |
color |
Arc color | Optional | "#54B399" |
animate |
Determines if the arc is animated | Optional | true |
weight |
Arc line thickness | Optional | 1 |
source_label |
Label at the source location | Optional | |
destination_label |
Label at the destination location | Optional | |
pulse_at_source |
If true, the pulse begins at the source instead of the destination | Optional | false |
[TBC: QUOTE]
<hr>
The Threat Map visualization can be added to other dashboards in two ways:
- Click the Duplicate button in the top-right corner of the dashboard.
- A clone of the dashboard will be created for your customization.
Click the three dots in the top-right corner of the visualization and select Copy to Dashboard.
Choose one of the following options:
- Existing Dashboard:* Select an existing dashboard from the dropdown, then click *Copy and Go to Dashboard.
- New Dashboard: Create a new dashboard with the visualization.

The Threat Map dashboard includes the following visualizations:
Framework: Utilizes Vega within Kibana.
Fields Used:
source.geo.location,destination.geo.location,color,animate,weight,source_label, anddestination_label.Customization:
- Click the three dots in the top-right corner and select Maximize to enlarge.
- The map adapts to Kibana’s dark/light mode automatically. Read more.
Includes four tables for analyzing traffic flow:
- Source/Destination Countries: Shows the top 5 countries with the highest traffic flow.
- Source/Destination IPs: Shows the top 5 IPs with the highest traffic flow.
Data in panels can be sorted by clicking on the Count column header.
<hr>
- Use KQL (Kibana Query Language) in the query bar at the top of the dashboard.
- Adjust the time range using the selector in the top-right corner (default: last 30 minutes).
- Maximum records displayed: 10,000.
- Click the three dots in the top-right corner of the map and select Edit Visualization.
- Apply a filter using the query bar.
- Click Save and Return to apply changes.
The following options are available for customization:
| Option | Description | Default Value |
|---|---|---|
emsTileServiceId |
Sets the EMS-layer for the map. | "undefined" |
Latitude |
Starting latitude of the map | 10 |
Longitude |
Starting longitude of the map | 0 |
Zoom |
Starting zoom level of the map | 1.3 |
scrollWheelZoom |
If true, disables mouse wheel zoom to avoid accidental zooming | falses |
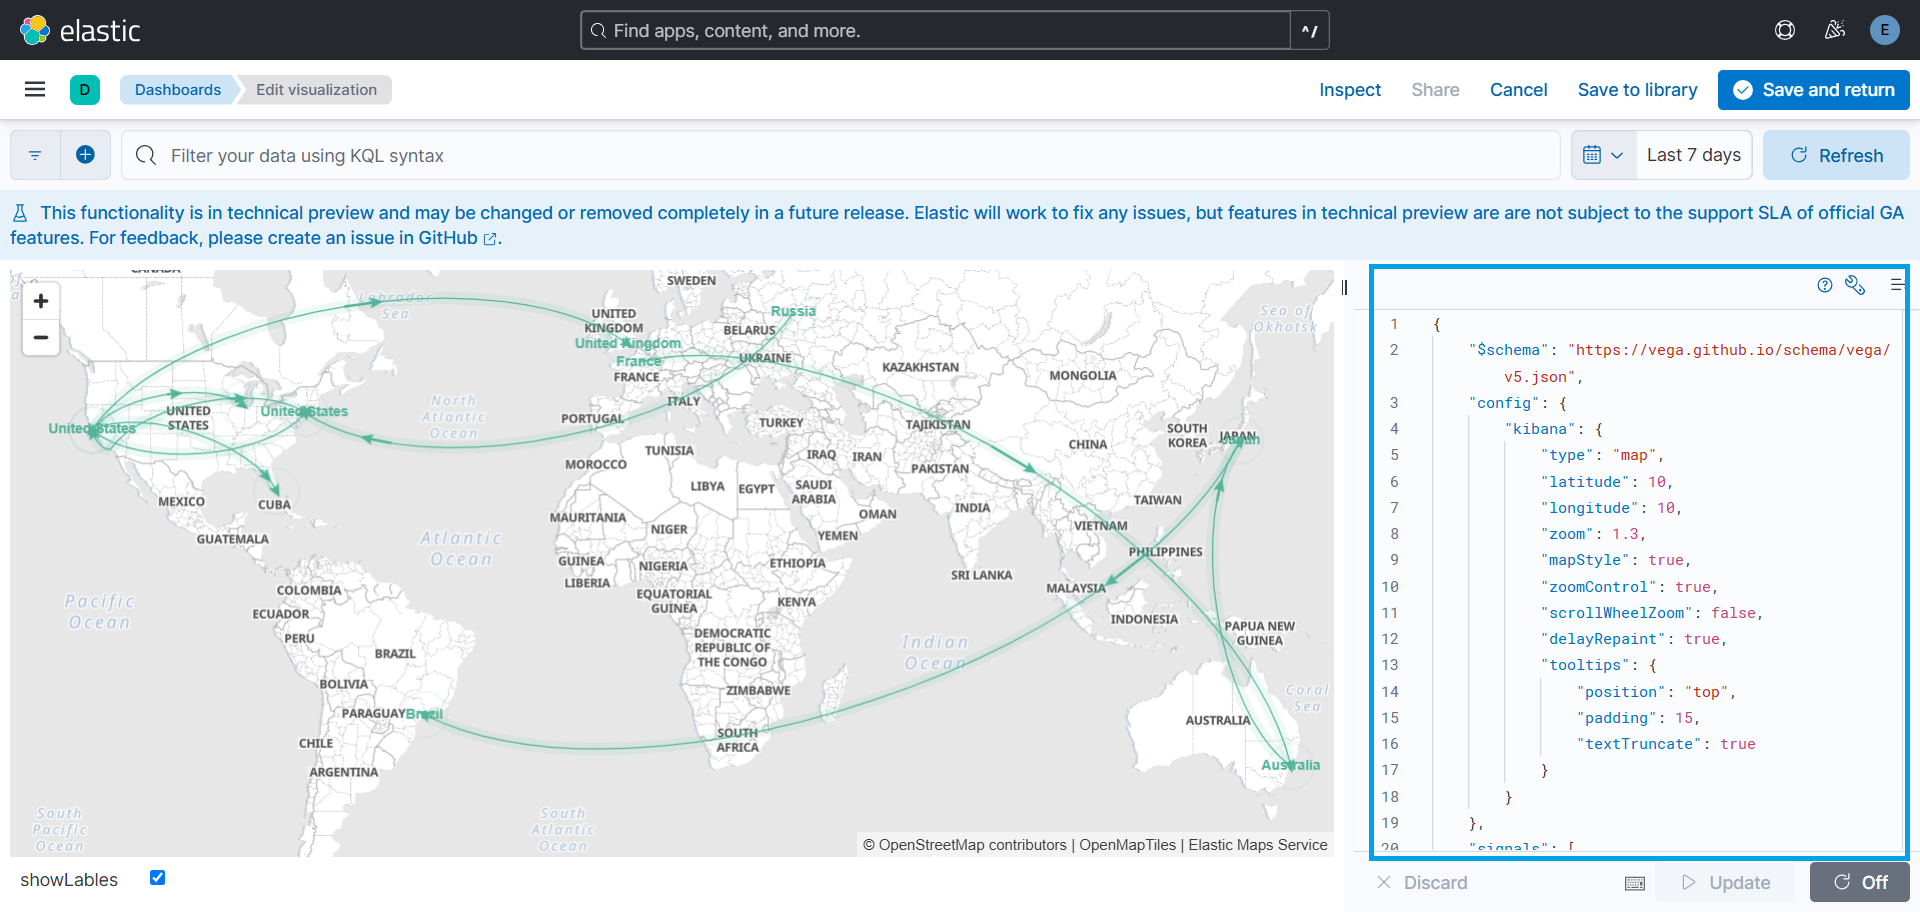
To customize these options, click on Edit visualization from the dropdown in the top right corner of the visualization. A Vega editor will open, where you can modify the following configurations.
For additional customization options, see the Vega Kibana Guide.
**Changelog**
| Version | Details | Kibana version(s) |
|---|---|---|
| 0.1.2 | pass:[] Bug fix (View pull request) Fix the Invalid SVG path error caused by the geo_point type for source and destination geolocation fields. |
— |
| 0.1.1 | pass:[] Bug fix (View pull request) Fix the DSL query to fetch only the fields used in the threat map visualization. |
— |
| 0.1.0 | pass:[] Enhancement (View pull request) Initial draft of the package |
— |