IIS application_pool metricset
This is the application_pool metricset of the module iis.
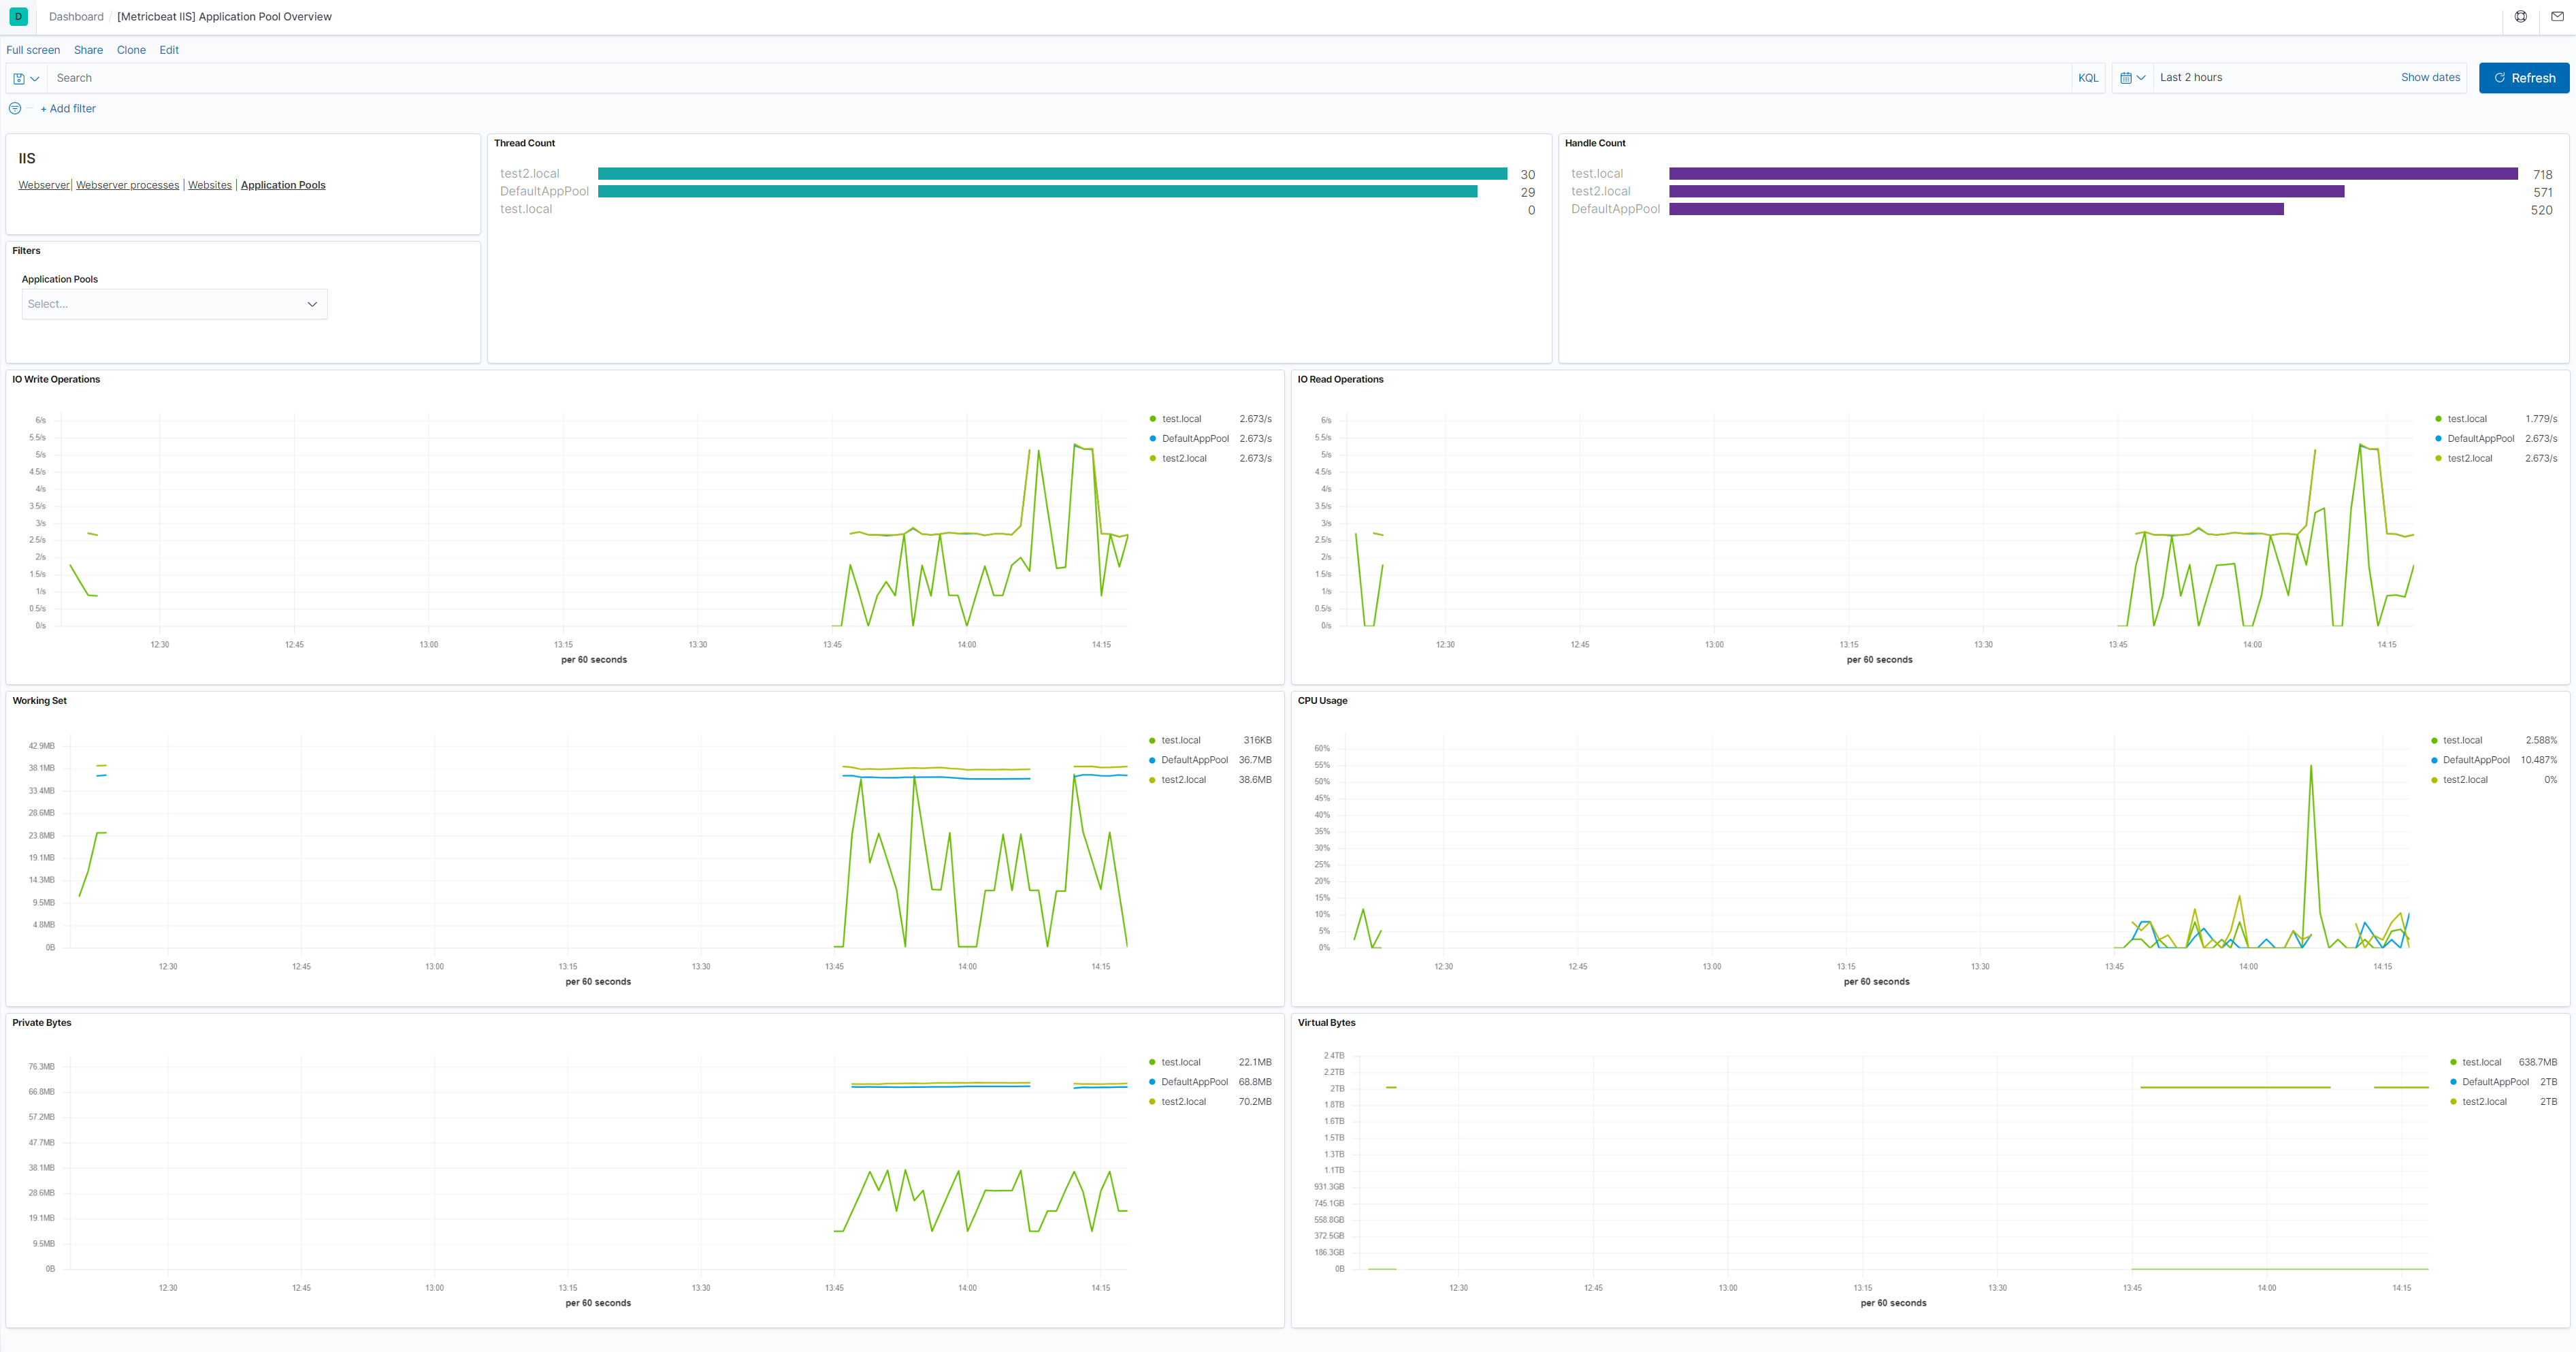
This metricset allows users to retrieve relevant metrics for the application pools running on IIS.
Metric values are divided in several groups:
The process object contains System/Process counters like the the overall server and CPU usage for the IIS Worker Process and memory (currently used and available memory for the IIS Worker Process).
The net_clr object which returns ASP.NET error rate counter values. Users can specify the application pools they would like to monitor using the configuration option application_pool.name, else, all application pools are considered.
For a description of each field in the metricset, see the exported fields section.
Here is an example document generated by this metricset:
{
"@timestamp": "2017-10-12T08:05:34.853Z",
"event": {
"dataset": "iis.application_pool",
"duration": 115000,
"module": "iis"
},
"iis": {
"application_pool": {
"name": "test.local",
"net_clr": {
"total_exceptions_thrown": 0,
"finallys_per_sec": 0,
"exceptions_thrown_per_sec": 0,
"locks_and_threads": {
"current_queue_length": 0,
"contention_rate_per_sec": 0
},
"memory": {
"gen_2_heap_size": 0,
"large_object_heap_size": 0,
"gen_1_heap_size": 0,
"gen_1_collections": 0,
"gen_0_heap_size": 0,
"bytes_in_all_heaps": 0,
"total_committed_bytes": 0,
"gen_0_collections": 0,
"gen_2_collections": 0,
"allocated_bytes_per_sec": 0,
"time_in_gc_perc": 0
},
"filters_per_sec": 0,
"throw_to_catch_depth_per_sec": 0
},
"process": {
"handle_count": 532,
"private_byte": 35258368,
"thread_count": 29,
"virtual_bytes": 667226112,
"working_set": 36044800
}
}
},
"metricset": {
"name": "application_pool",
"period": 10000
},
"process": {
"pid": 748
},
"service": {
"type": "iis"
}
}