Run Elastic Agent in a container
You can run Elastic Agent inside a container — either with Fleet Server or standalone. Docker images for all versions of Elastic Agent are available from the Elastic Docker registry. If you are running in Kubernetes, refer to run Elastic Agent on ECK.
Note that running Elastic Agent in a container is supported only in Linux environments. For this reason we don’t currently provide Elastic Agent container images for Windows.
Considerations:
- When Elastic Agent runs inside a container, it cannot be upgraded through Fleet as it expects that the container itself is upgraded.
- Enrolling and running an Elastic Agent is usually a two-step process. However, this doesn’t work in a container, so a special subcommand,
container, is called. This command allows environment variables to configure all properties, and runs theenrollandruncommands as a single command.
Elasticsearch for storing and searching your data, and Kibana for visualizing and managing it.
To get started quickly, spin up a deployment of our hosted Elasticsearch Service. The Elasticsearch Service is available on AWS, GCP, and Azure. Try it out for free.
To install and run Elasticsearch and Kibana, see Installing the Elastic Stack.
There are two images for Elastic Agent, elastic-agent and elastic-agent-complete. The elastic-agent image contains all the binaries for running Beats, while the elastic-agent-complete image contains these binaries plus additional dependencies to run browser monitors through Elastic Synthetics. Refer to Synthetic monitoring via Elastic Agent and Fleet for more information.
Run the docker pull command against the Elastic Docker registry:
docker pull docker.elastic.co/elastic-agent/elastic-agent:9.0.0-beta1
Alternately, you can use the hardened Wolfi image. Using Wolfi images requires Docker version 20.10.10 or later. For details about why the Wolfi images have been introduced, refer to our article Reducing CVEs in Elastic container images.
docker pull docker.elastic.co/elastic-agent/elastic-agent-wolfi:9.0.0-beta1
If you want to run Synthetics tests, run the docker pull command to fetch the elastic-agent-complete image:
docker pull docker.elastic.co/elastic-agent/elastic-agent-complete:9.0.0-beta1
To run Synthetics tests using the hardened Wolfi image, run:
docker pull docker.elastic.co/elastic-agent/elastic-agent-complete-wolfi:9.0.0-beta1
Although it’s optional, we highly recommend verifying the signatures included with your downloaded Docker images to ensure that the images are valid.
Elastic images are signed with Cosign which is part of the Sigstore project. Cosign supports container signing, verification, and storage in an OCI registry. Install the appropriate Cosign application for your operating system.
Run the following commands to verify the elastic-agent container image signature for Elastic Agent v9.0.0-beta1:
wget https://artifacts.elastic.co/cosign.pub 1
cosign verify --key cosign.pub docker.elastic.co/elastic-agent/elastic-agent:9.0.0-beta1 2
- Download the Elastic public key to verify container signature
- Verify the container against the Elastic public key
If you’re using the elastic-agent-complete image, run the commands as follows:
wget https://artifacts.elastic.co/cosign.pub
cosign verify --key cosign.pub docker.elastic.co/elastic-agent/elastic-agent-complete:9.0.0-beta1
The command prints the check results and the signature payload in JSON format, for example:
Verification for docker.elastic.co/elastic-agent/elastic-agent-complete:9.0.0-beta1 --
The following checks were performed on each of these signatures:
- The cosign claims were validated
- Existence of the claims in the transparency log was verified offline
- The signatures were verified against the specified public key
The Elastic Agent container command offers a wide variety of options. To see the full list, run:
docker run --rm docker.elastic.co/elastic-agent/elastic-agent:9.0.0-beta1 elastic-agent container -h
docker run \
--env FLEET_ENROLL=1 \ 1
--env FLEET_URL=<fleet-server-host-url> \ 2
--env FLEET_ENROLLMENT_TOKEN=<enrollment-token> \ 3
--rm docker.elastic.co/elastic-agent/elastic-agent:9.0.0-beta1 4
- Set to 1 to enroll the Elastic Agent into Fleet Server.
- URL to enroll the Fleet Server into. You can find it in Kibana. Select Management → Fleet → Fleet Settings, and copy the Fleet Server host URL.
- The token to use for enrollment. Close the flyout panel and select Enrollment tokens. Find the Agent policy you want to enroll Elastic Agent into, and display and copy the secret token. To learn how to create a policy, refer to Create an agent policy without using the UI.
- If you want to run elastic-agent-complete image, replace
elastic-agenttoelastic-agent-complete. Use theelastic-agentuser instead of root to run Synthetics Browser tests. Synthetic tests cannot run under the root user. Refer to Synthetics Fleet Quickstart for more information.
Refer to Environment variables for all available options.
If you’re running a self-managed cluster and want to run your own Fleet Server, run the following command, which will spin up both Elastic Agent and Fleet Server in a container:
docker run \
--env FLEET_SERVER_ENABLE=true \ 1
--env FLEET_SERVER_ELASTICSEARCH_HOST=<elasticsearch-host> \ 2
--env FLEET_SERVER_SERVICE_TOKEN=<service-token> \ 3
--env FLEET_SERVER_POLICY_ID=<fleet-server-policy> \ 4
-p 8220:8220 \ 5
--rm docker.elastic.co/elastic-agent/elastic-agent:9.0.0-beta1 6
- Set to 1 to bootstrap Fleet Server on this Elastic Agent.
- Your cluster’s Elasticsearch host URL.
- The Fleet service token. Generate one in the Fleet UI if you don’t have one already.
- ID of the Fleet Server policy. We recommend only having one fleet-server policy. To learn how to create a policy, refer to Create an agent policy without using the UI.
- publish container port 8220 to host.
- If you want to run the elastic-agent-complete image, replace
elastic-agentwithelastic-agent-complete. Use theelastic-agentuser instead of root to run Synthetics Browser tests. Synthetic tests cannot run under the root user. Refer to Synthetics Fleet Quickstart for more information.
Refer to Environment variables for all available options.
If you need to run Fleet Server as well, adjust the docker run command above by adding these environment variables:
--env FLEET_SERVER_ENABLE=true \ 1
--env FLEET_SERVER_ELASTICSEARCH_HOST=<elasticsearch-host> \ 2
--env FLEET_SERVER_SERVICE_TOKEN=<service-token> 3
- Set to
trueto bootstrap Fleet Server on this Elastic Agent. This automatically forces Fleet enrollment as well. - The Elasticsearch host for Fleet Server to communicate with, for example
http://elasticsearch:9200. - Service token to use for communication with Elasticsearch and Kibana.
Running Elastic Agent on a read-only file system
If you’d like to run Elastic Agent in a Docker container on a read-only file system, you can do so by specifying the --read-only option. Elastic Agent requires a stateful directory to store application data, so with the --read-only option you also need to use the --mount option to specify a path to where that data can be stored.
For example:
docker run --rm --mount source=$(pwd)/state,destination=/state -e {STATE_PATH}=/state --read-only docker.elastic.co/elastic-agent/elastic-agent:9.0.0-beta1 1
- Where
{STATE_PATH}is the path to a stateful directory to mount where Elastic Agent application data can be stored.
You can also add type=tmpfs to the mount parameter (--mount type=tmpfs,destination=/state...) to specify a temporary file storage location. This should be done with caution as it can cause data duplication, particularly for logs, when the container is restarted, as no state data is persisted.
Launch Kibana:
- Log in to your Elastic Cloud account.
- Navigate to the Kibana endpoint in your deployment.
Point your browser to http://localhost:5601, replacing
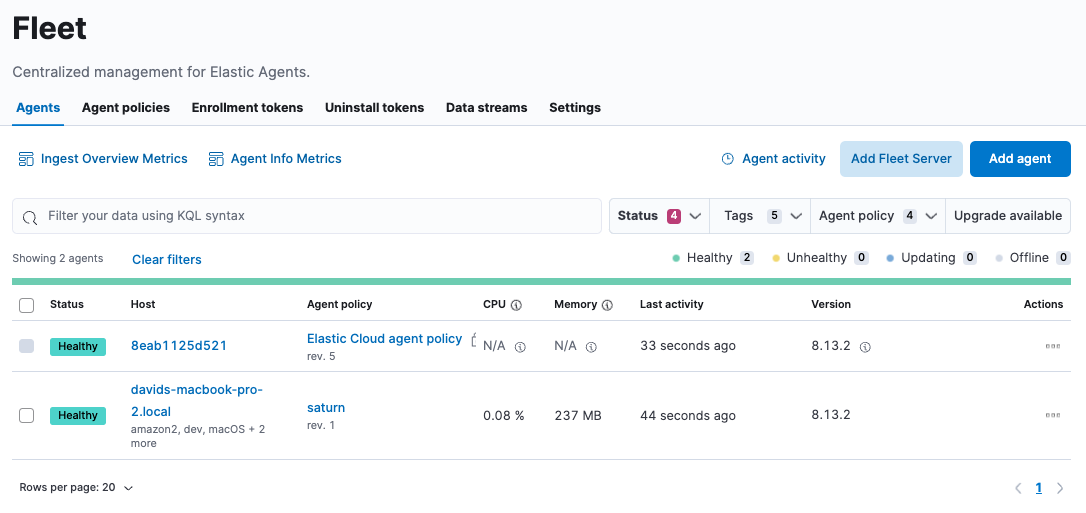
localhostwith the name of the Kibana host.To check if your Elastic Agent is enrolled in Fleet, go to Management → Fleet → Agents.
To view data flowing in, go to Analytics → Discover and select the index
metrics-*, or even more specific,metrics-kubernetes.*. If you can’t see these indexes, create a data view for them.To view predefined dashboards, either select Analytics→Dashboard or install assets through an integration.
You can run Elastic Agent in docker-compose. The example below shows how to enroll an Elastic Agent:
version: "3"
services:
elastic-agent:
image: docker.elastic.co/elastic-agent/elastic-agent:9.0.0-beta1 1
container_name: elastic-agent
restart: always
user: root 2
environment:
- FLEET_ENROLLMENT_TOKEN=<enrollment-token>
- FLEET_ENROLL=1
- FLEET_URL=<fleet-server-url>
- Switch
elastic-agenttoelastic-agent-completeif you intend to use the complete version. Use theelastic-agentuser instead of root to run Synthetics Browser tests. Synthetic tests cannot run under the root user. Refer to Synthetics Fleet Quickstart for more information. - Synthetic browser monitors require this set to
elastic-agent.
If you need to run Fleet Server as well, adjust the docker-compose file above by adding these environment variables:
- FLEET_SERVER_ENABLE=true
- FLEET_SERVER_ELASTICSEARCH_HOST=<elasticsearch-host>
- FLEET_SERVER_SERVICE_TOKEN=<service-token>
Refer to Environment variables for all available options.
Since a container supports only a single version of Elastic Agent, logs and state are stored a bit differently than when running an Elastic Agent outside of a container. The logs can be found under: /usr/share/elastic-agent/state/data/logs/*.
It’s important to note that only the logs from the Elastic Agent process itself are logged to stdout. Subprocess logs are not. Each subprocess writes its own logs to the default directory inside the logs directory:
/usr/share/elastic-agent/state/data/logs/default/*
Running into errors with Fleet Server? Check the fleet-server subprocess logs for more information.
A monitoring endpoint can be enabled to expose resource usage and event processing data. The endpoint is compatible with Elastic Agents running in both Fleet mode and Standalone mode.
Enable the monitoring endpoint in elastic-agent.yml on the host where the Elastic Agent is installed. A sample configuration looks like this:
agent.monitoring:
enabled: true 1
logs: true 2
metrics: true 3
http:
enabled: true 4
host: localhost 5
port: 6791 6
- Enable monitoring of running processes.
- Enable log monitoring.
- Enable metrics monitoring.
- Expose Elastic Agent metrics over HTTP. By default, sockets and named pipes are used.
- The hostname, IP address, Unix socket, or named pipe that the HTTP endpoint will bind to. When using IP addresses, we recommend only using
localhost. - The port that the HTTP endpoint will bind to.
The above configuration exposes a monitoring endpoint at http://localhost:6791/processes.
`http://localhost:6791/processes` output
{
"processes":[
{
"id":"metricbeat-default",
"pid":"36923",
"binary":"metricbeat",
"source":{
"kind":"configured",
"outputs":[
"default"
]
}
},
{
"id":"filebeat-default-monitoring",
"pid":"36924",
"binary":"filebeat",
"source":{
"kind":"internal",
"outputs":[
"default"
]
}
},
{
"id":"metricbeat-default-monitoring",
"pid":"36925",
"binary":"metricbeat",
"source":{
"kind":"internal",
"outputs":[
"default"
]
}
}
]
}
Each process ID in the /processes output can be accessed for more details.
`http://localhost:6791/processes/{{process-name}}` output
{
"beat":{
"cpu":{
"system":{
"ticks":537,
"time":{
"ms":537
}
},
"total":{
"ticks":795,
"time":{
"ms":796
},
"value":795
},
"user":{
"ticks":258,
"time":{
"ms":259
}
}
},
"info":{
"ephemeral_id":"eb7e8025-7496-403f-9f9a-42b20439c737",
"uptime":{
"ms":75332
},
"version":"7.14.0"
},
"memstats":{
"gc_next":23920624,
"memory_alloc":20046048,
"memory_sys":76104712,
"memory_total":60823368,
"rss":83165184
},
"runtime":{
"goroutines":58
}
},
"libbeat":{
"config":{
"module":{
"running":4,
"starts":4,
"stops":0
},
"reloads":1,
"scans":1
},
"output":{
"events":{
"acked":0,
"active":0,
"batches":0,
"dropped":0,
"duplicates":0,
"failed":0,
"toomany":0,
"total":0
},
"read":{
"bytes":0,
"errors":0
},
"type":"elasticsearch",
"write":{
"bytes":0,
"errors":0
}
},
"pipeline":{
"clients":4,
"events":{
"active":231,
"dropped":0,
"failed":0,
"filtered":0,
"published":231,
"retry":112,
"total":231
},
"queue":{
"acked":0,
"max_events":4096
}
}
},
"metricbeat":{
"system":{
"cpu":{
"events":8,
"failures":0,
"success":8
},
"filesystem":{
"events":80,
"failures":0,
"success":80
},
"memory":{
"events":8,
"failures":0,
"success":8
},
"network":{
"events":135,
"failures":0,
"success":135
}
}
},
"system":{
"cpu":{
"cores":8
},
"load":{
"1":2.5957,
"15":5.415,
"5":3.5815,
"norm":{
"1":0.3245,
"15":0.6769,
"5":0.4477
}
}
}
}